-
MYP
- Home
-
IGCSE
- Course information
-
Physical: Hazardous environments
>
- Distribution of tectonic hazards
- Causes of tsunami
- Measuring earthquakes
- Earthquake case study 1: Haiti
- Earthquake case study 2: Christchurch
- Why do earthquakes do more damage in LICs than in HICs?
- How are volcanic eruptions measured?
- Tropical storms - distribution
- Causes of tropical cyclones
- Tropical cyclones - case study
- Why live in hazardous areas?
-
River Environments
>
- Hydrological cycle
- River basins
- Factors affecting river regimes
- Fluvial processes: erosion
- Fluvial processes: weathering and mass movement
- Fluvial processes: transportation and depositon
- River features and their formation
- How rivers change from source to mouth
- Uses of water
- Water pollution
- Water supply
-
IBDP
-
Changing population
>
- Global patterns of economic development
- Physical and human factors affecting global population distribution
- Case study 1: China
- Case study 2: Niger
- Demographic transition
- Megacity growth
- Forced migration and internal displacement
- Ageing populations
- Pro-natalist and anti-natalist policies
- Gender equality policies
- Trafficking policies
- The Demographic Dividend
-
Global climate vulnerability and resilience
>
- Atmospheric system
- The energy balance
- Changes in the energy balance
- The enhanced greenhouse effect
- Climate Change and the Hydrosphere, Atmosphere and Biosphere
- Impacts of climate change on people and places
- Disparities in exposure to climate change risk and vulnerability
- Government-led adaptation and mitigation strategies
- Civil society and corporate strategies
-
Global resource consumption and security
>
- Progress towards poverty reduction
- Measuring trends in global consumption
- Global patterns and trends in the availability and consumption of water
- Global patterns and trends in the availability and consumption of land/food
- Global patterns and trends in the availability and consumption of energy
- Water food and energy nexus
- Recycling and waste
- Malthus vs Boserup
- Resource Stewardship strategies
- Sustainable Development Goals
-
Freshwater - drainage basins
>
- The drainage basin as a system
- How rivers change from source to mouth
- River discharge
- River processes
- River landforms
- Factors affecting flood risk
- Attempts at flood prediction
- Flood mitigation
- Flood mitigation case studies
- Water scarcity
- Agricultural activities and water quality
- Pressures on lakes and aquifers
- Internationally shared water and conflict
- Water management: participation of local communities
- Dams as multi-purpose schemes
- Water management: Integrated Drainage Basin Management (IDBM)
- Managing wetlands
-
Leisure, Sport and Tourism
>
- Growth and purpose of leisure time
- Categories of tourism and sport
- Economic development and participation
- Factors affecting personal participation
- Factors affecting growth of tourism hotspots
- Spheres of influencee
- Factors affecting a national sports league
- Festivals
- Niche national tourism strategies
- Role of TNCs
- Tourism as a national development strategy
- International sporting events
- Consequences of unsustainable growth
- Sustainable tourism
- Future international tourism
- Political and cultural influences on sport
- Extended Essay in Geography >
- Skills/concepts >
-
Changing population
>
- Geography and ToK
- Theory of Knowledge
|
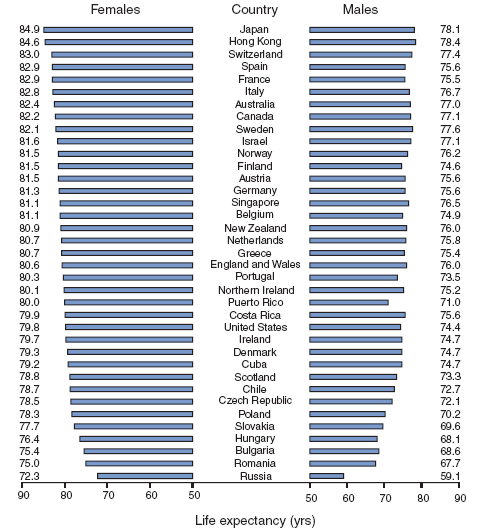
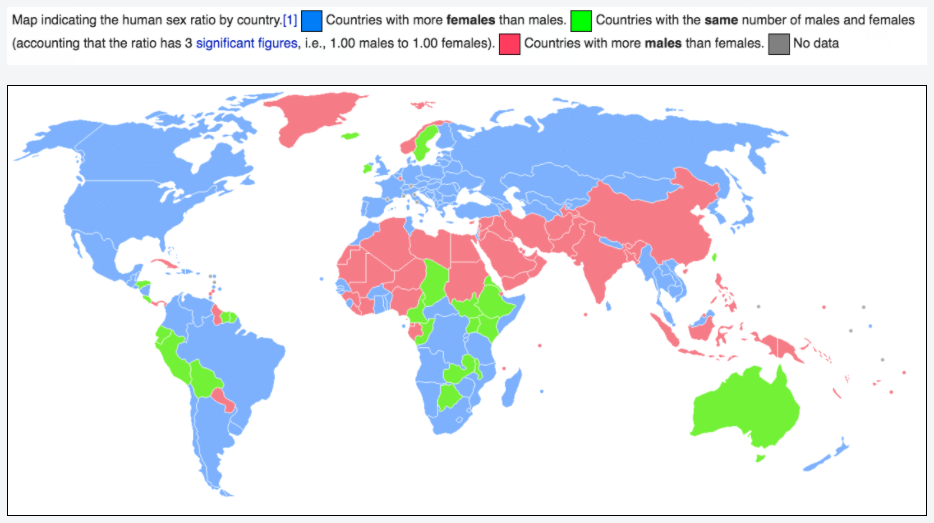
Study the graph (left) and the map (below) and use them to describe and explain the patterns of ageing/greying worldwide. What are the reasons for the patterns you identify? Which regions and which classifications of country are experiencing ageing and why? Why is this not the case for some areas of the world? |
|
Subject Guide
.Global and regional/continental trends in family size, sex ratios, and ageing/greying
A. Definitions
Family Size
This is the average number of children per family. A useful way to measure this is by examining changing fertility rates as these closely mirror the average family size. See this page.Demographic transition
Sex ratios
The sex ratio is a measure of how many males there are to females in a population. It is calculated by measuring the number of males in a population for every hundred females. So a national sex ratio of 98 would tell us that for every 100 females there were 98 males. A sex ratio greater than 100 indicates that a country has more males than females; a ratio of less than 100 shows that the country has more females than males.
Ageing/greying
This refers to an increase in the proportion of the population who are 65 or older. We an measure this by using the same approach as for old age dependency.
B. Sex ratios
According to the World Health Organisation, the natural sex ratio at birth is 105; in other words, for every 100 female babies born, there are 105 boys. This proportion is due to both biological and cultural factors. Biological factors include a range of influences on whether a sperm carrying an X or Y chromosome is more likely to fertilise an egg. Cultural factors include selective abortions of female foetuses in cultures where sons are valued more than daughters.
Male death rates tend to be higher than female death rates (see life expectancy data above). This is for several reasons:
These factors mean that the overall global sex ratio is approximately 101.
- males tend to be more involved in risky behaviour than females (fighting, drinking and smoking)
- men are more likely to have jobs in risky occupations than women eg mining, trawlermen
- men are more likely to be killed in wars and combat than women
- depression and suicide rates tend to be x3.5-5% higher among men than women
These factors mean that the overall global sex ratio is approximately 101.
|
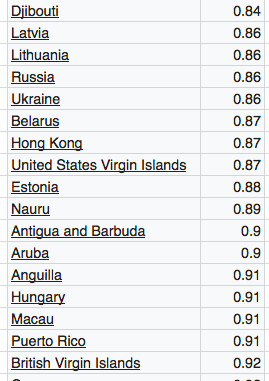
The world's lowest sex ratio is in Dijibouti. This is likely to be a result of the civil war which took place between 1991 and 2000 as well as significant economic migration of men. In Latvia, Lithuania, Russia, Ukraine and Belarus the low proportion of males is due to the remaining legacy of men lost in World War 2 and out migration.
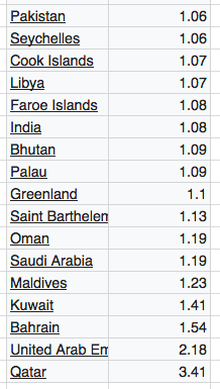
The countries with the highest sex ratios are oil rich states where exceptionally high male in-migration of building workers has skewed the balance of the population. |
Choose one country with a high sex-ratio and one with a low sex ratio. For each, research the reasons further and present your findings in the document below.
C. Ageing/greying populations
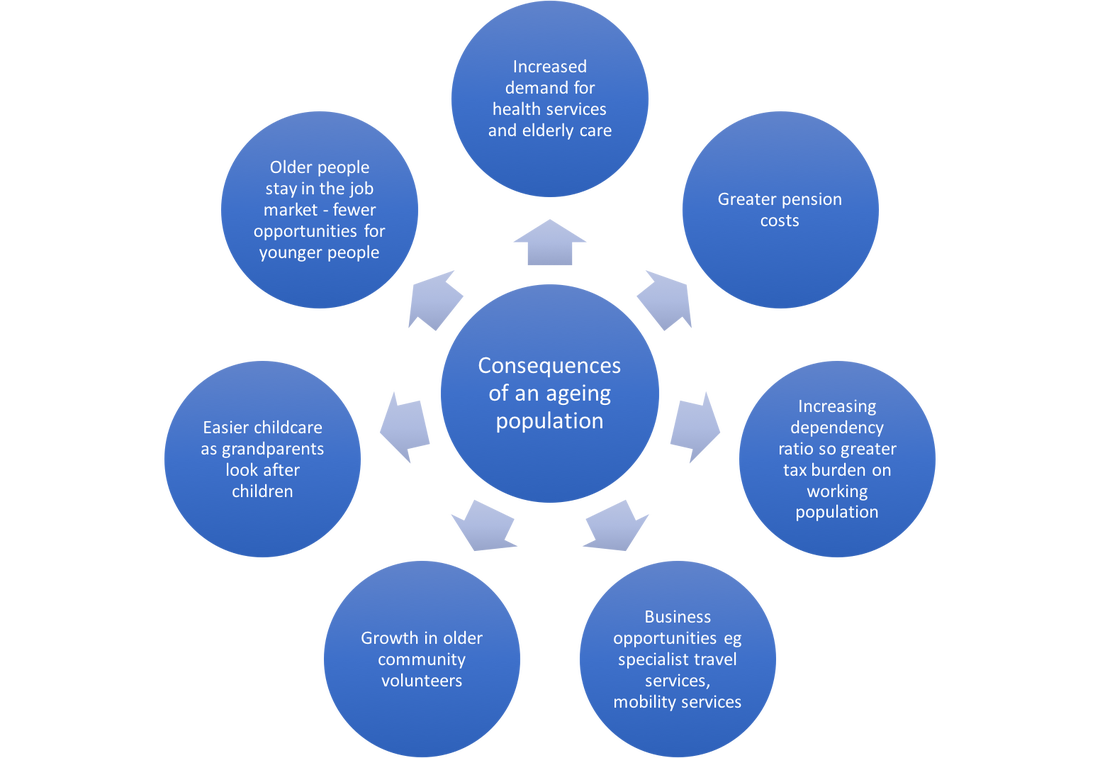
D. Consequences of ageing/greying populations
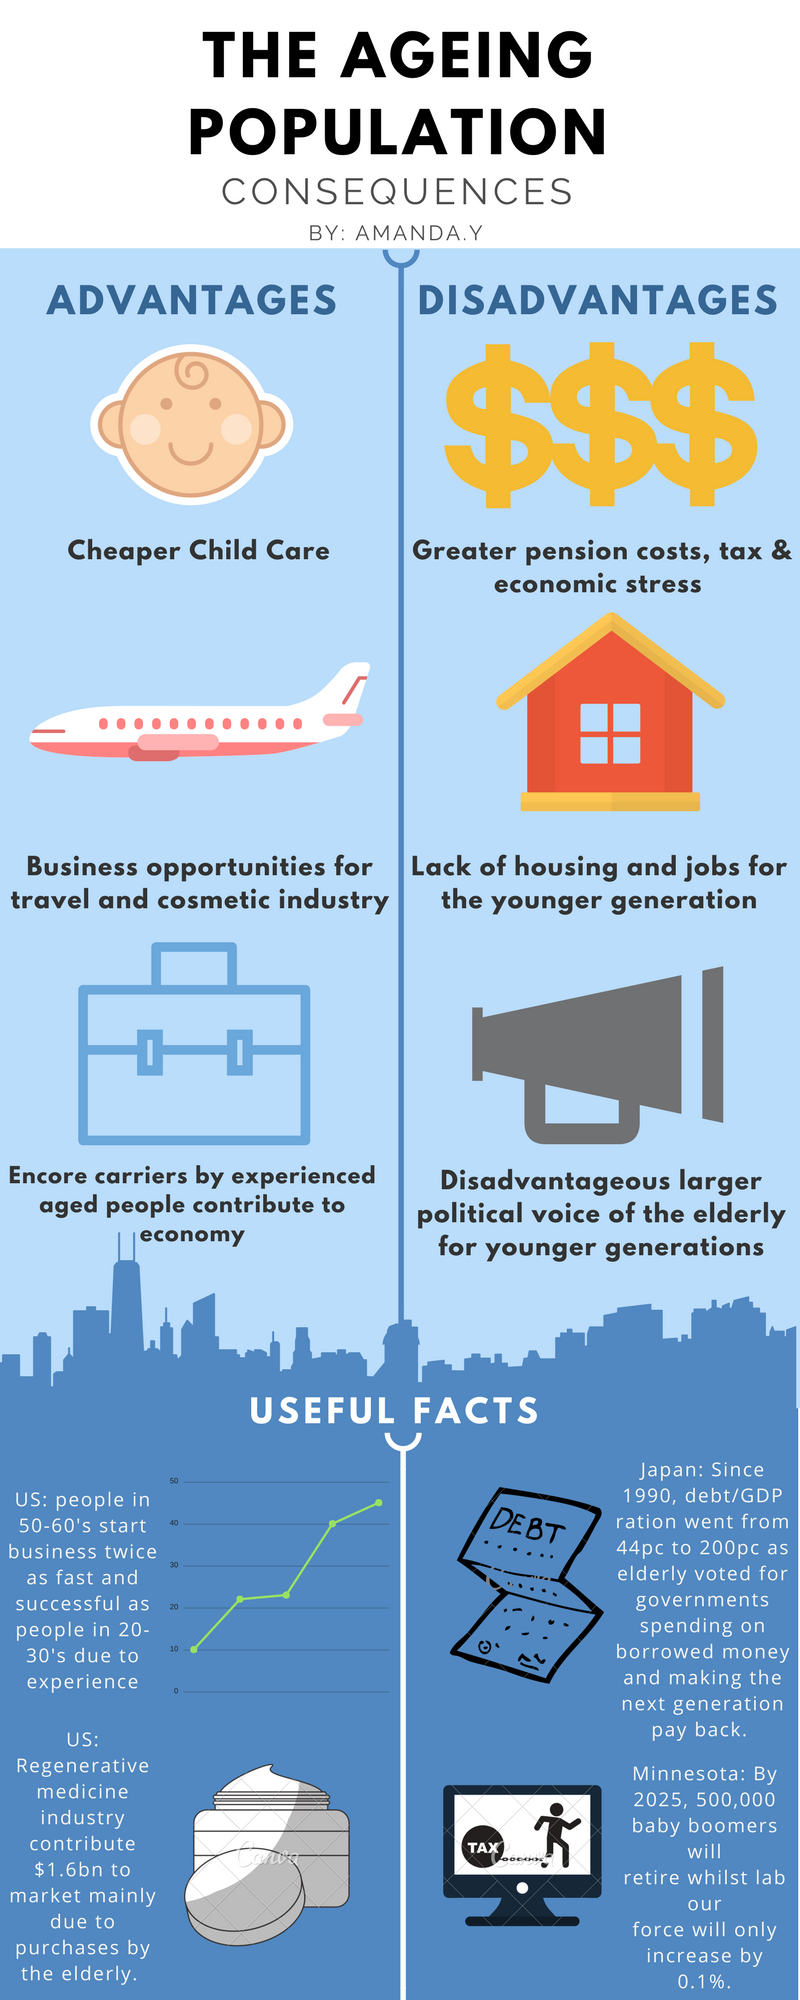
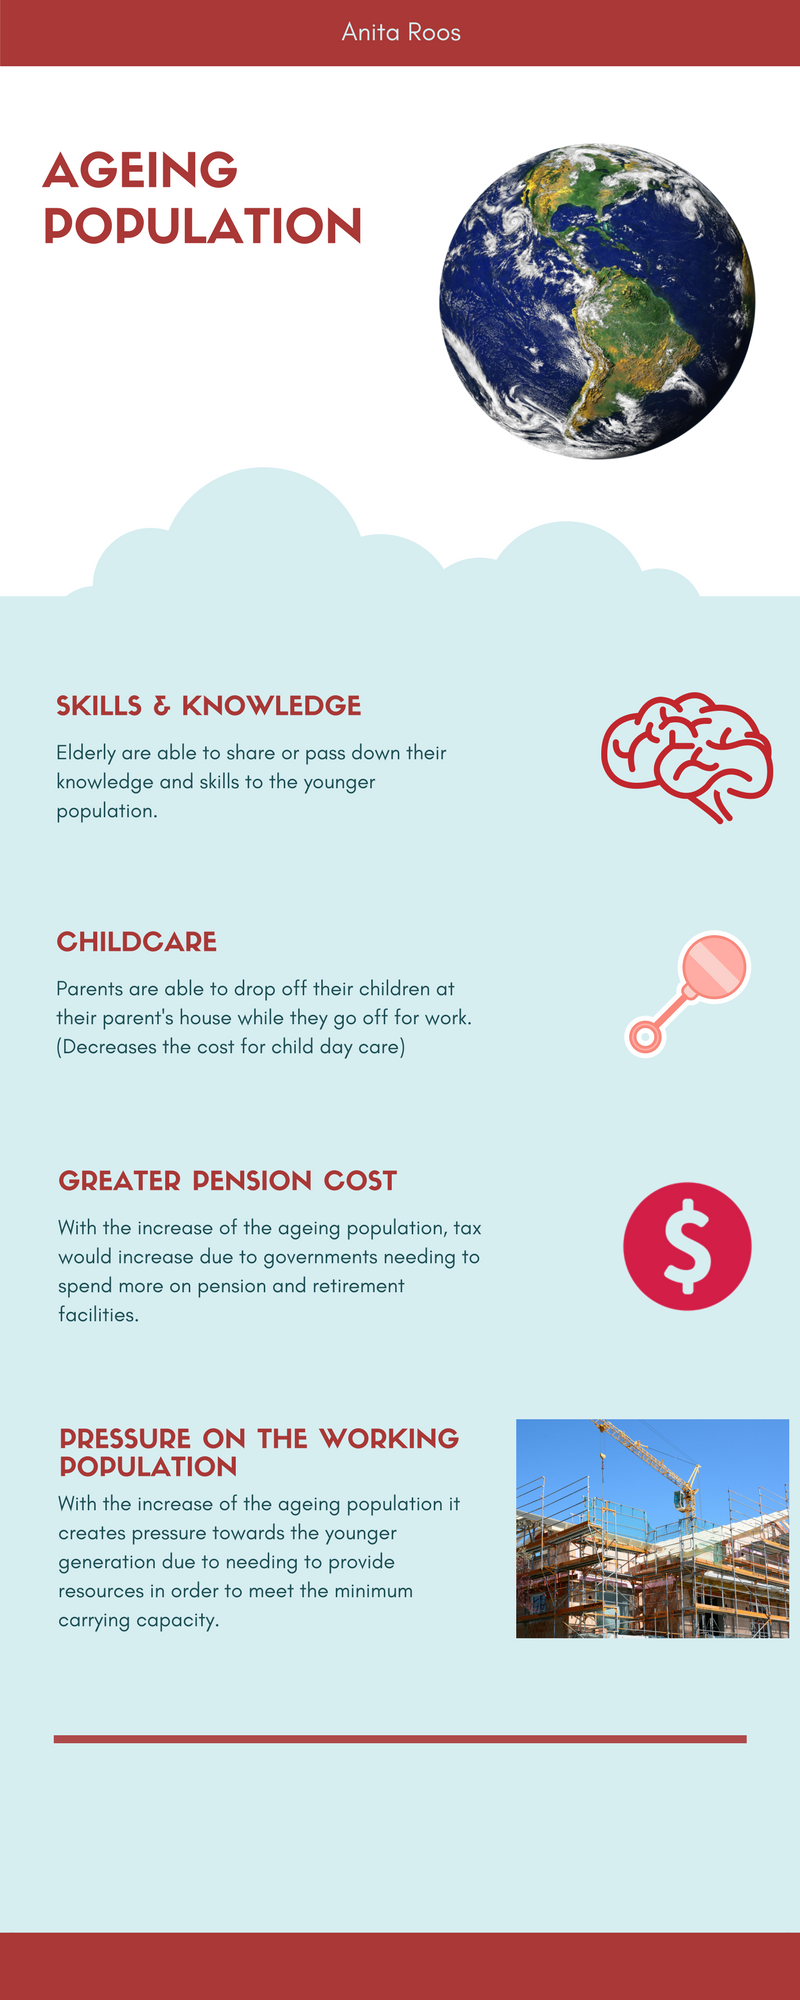
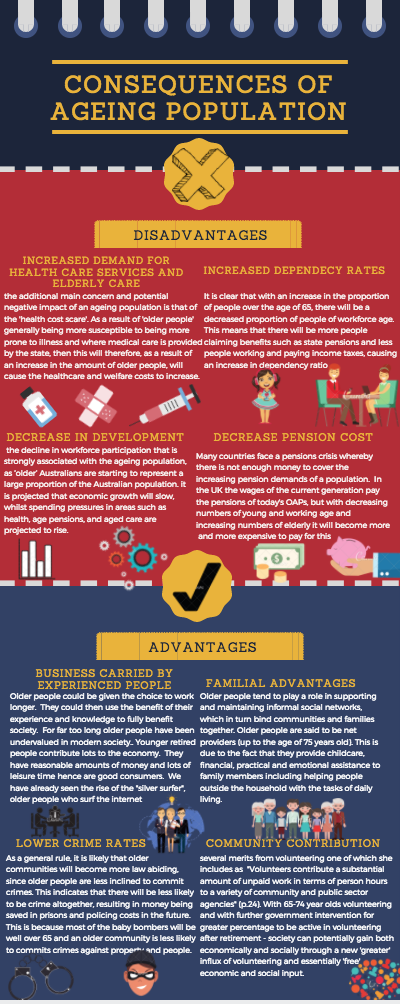
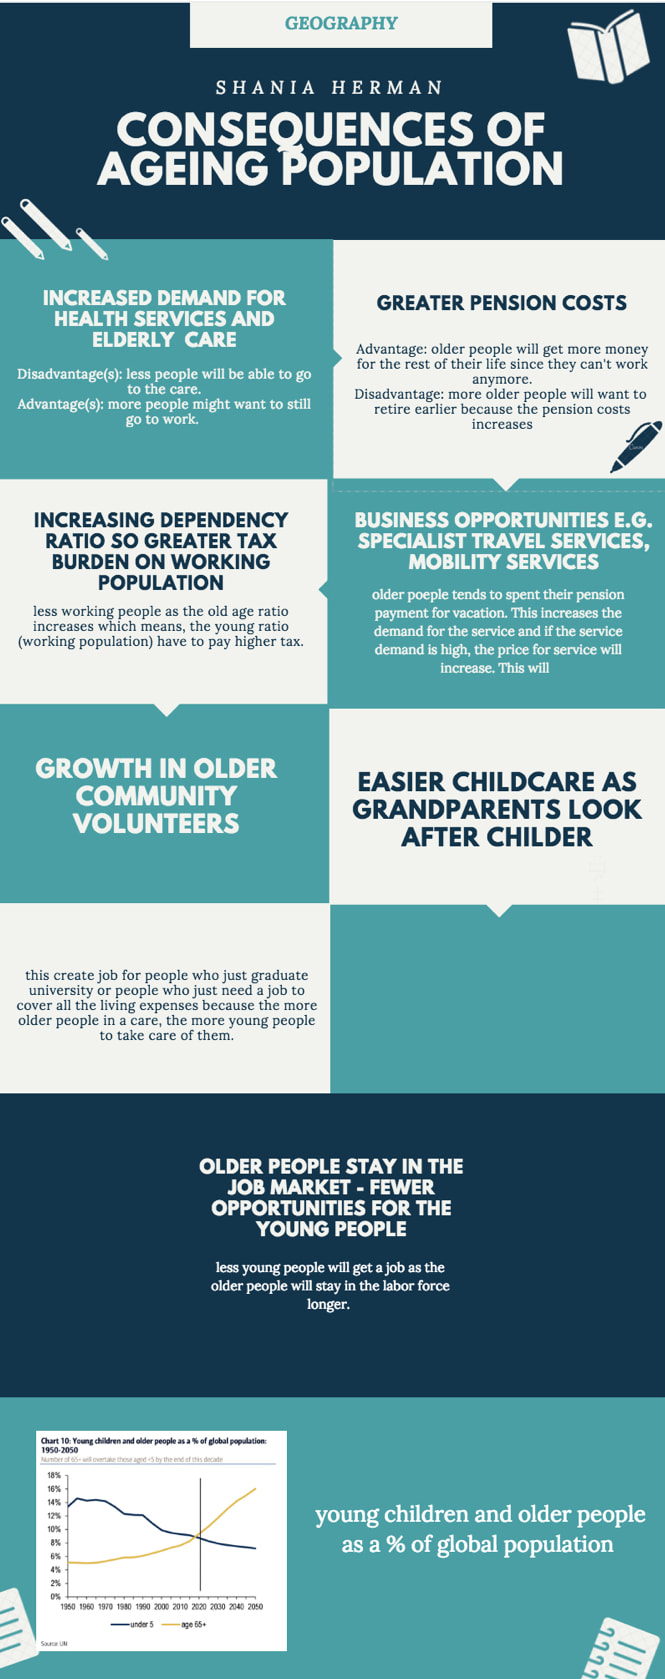
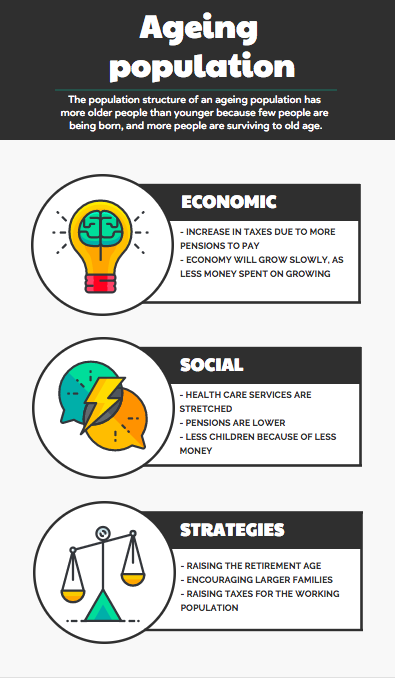
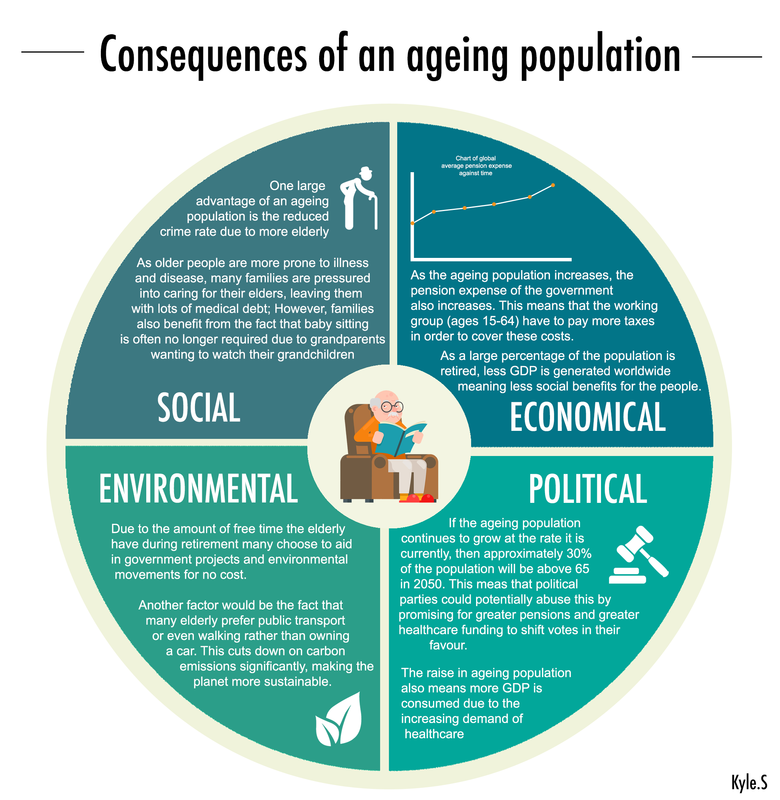
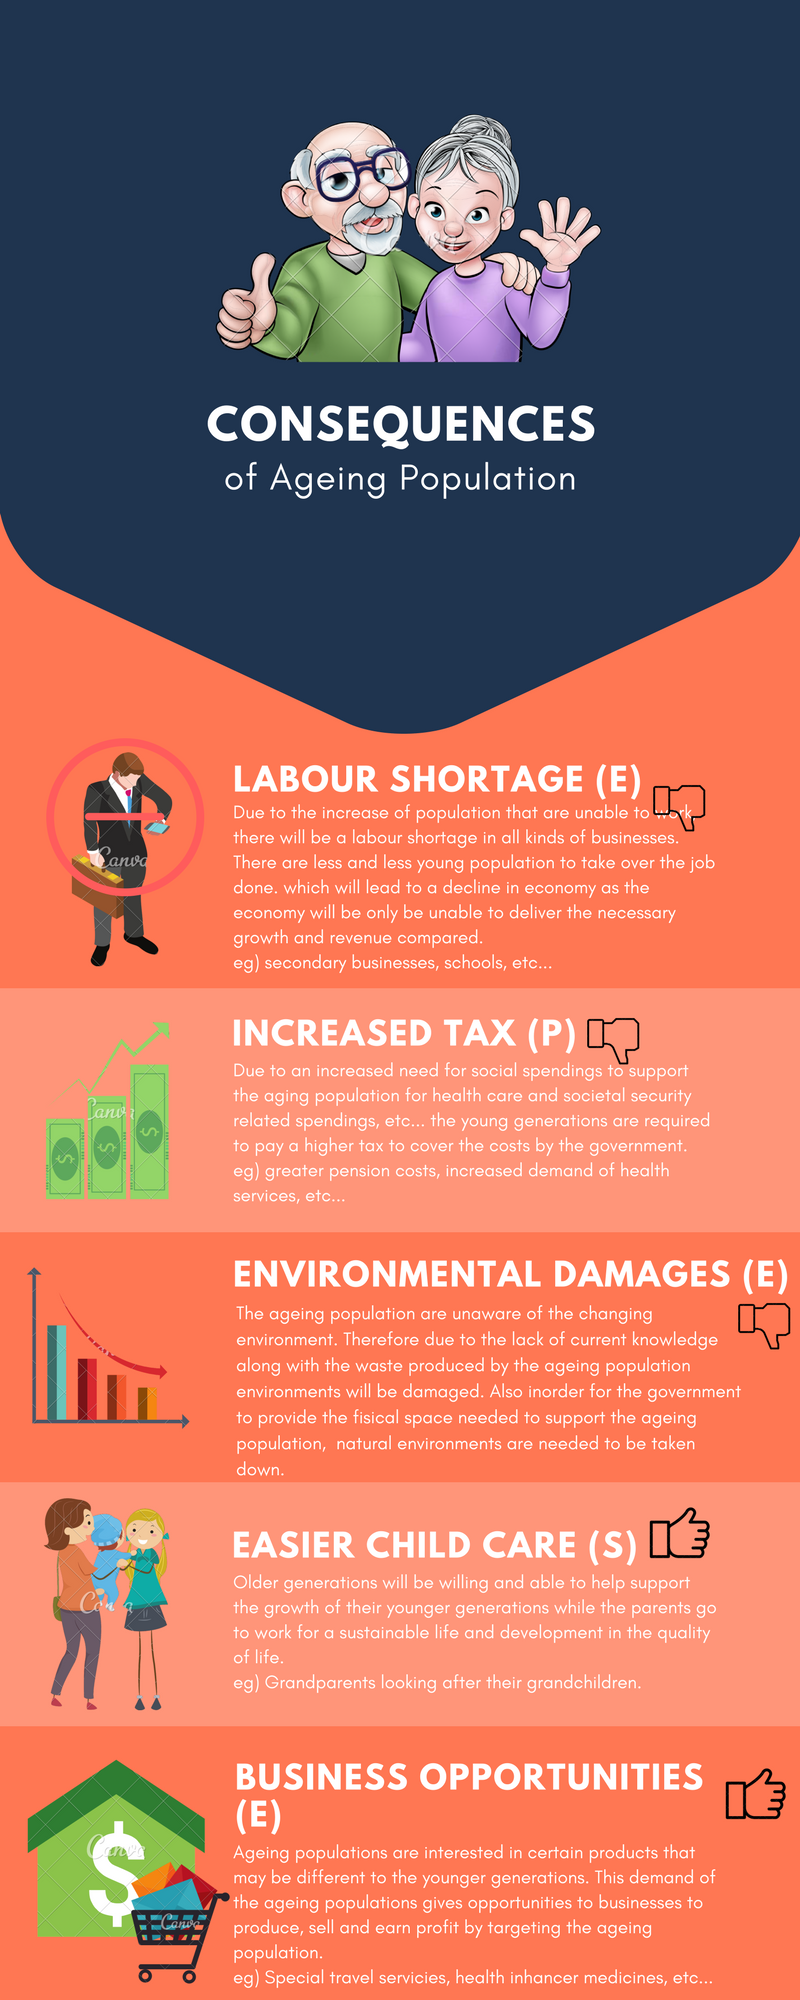
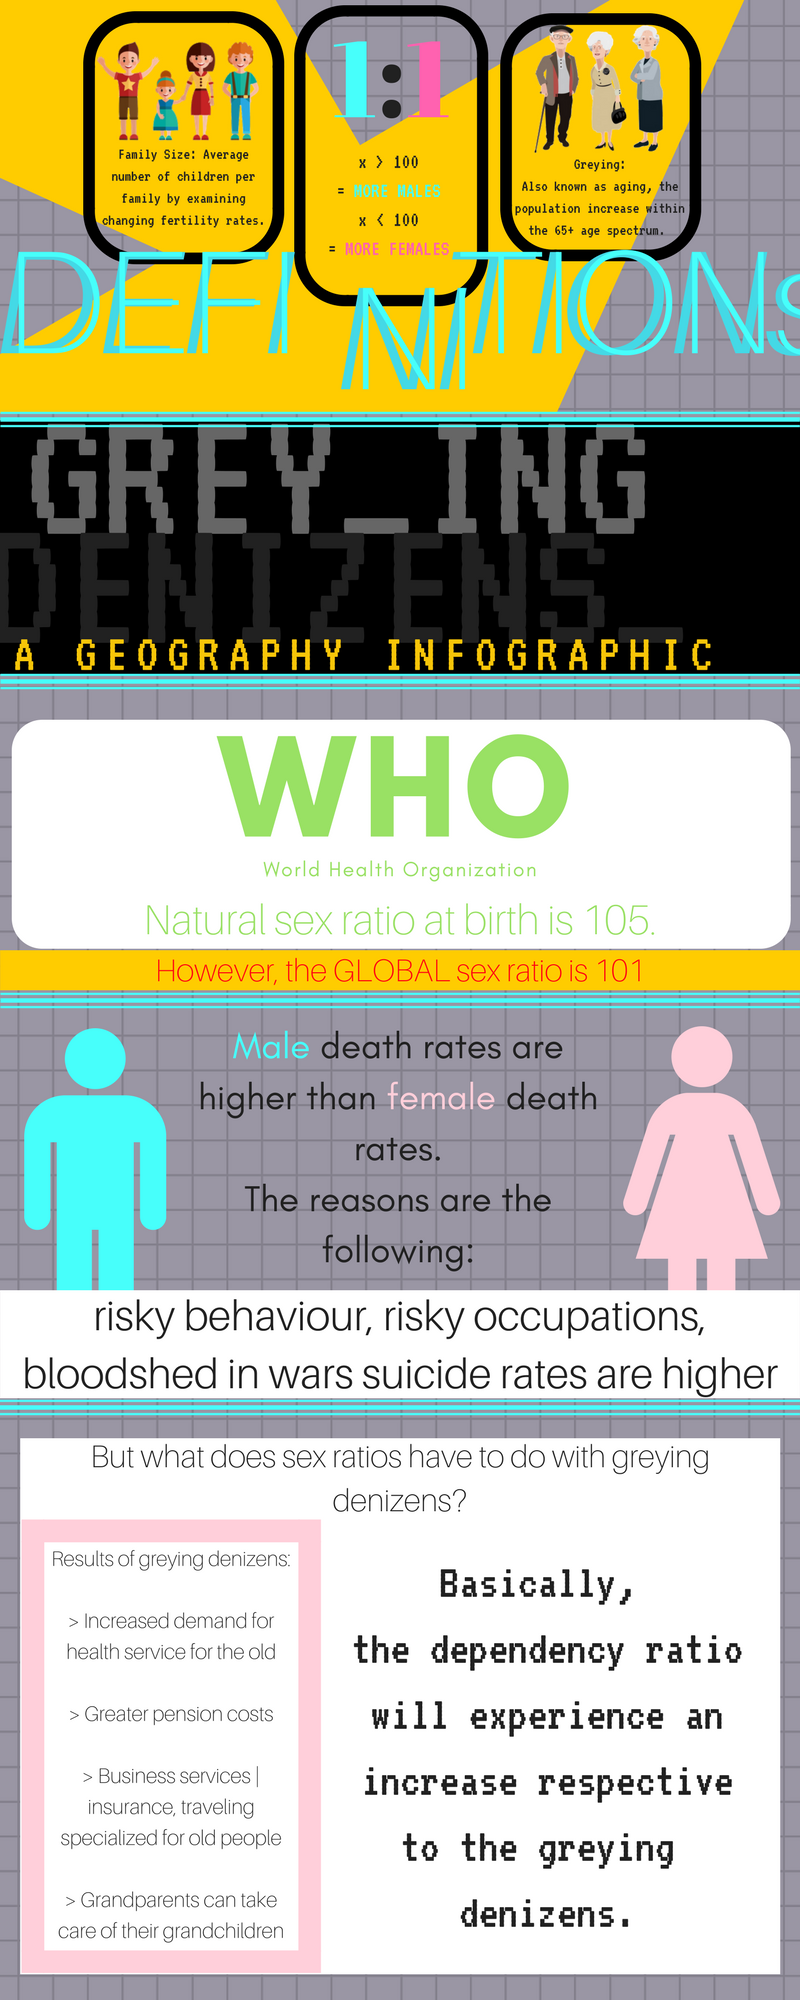
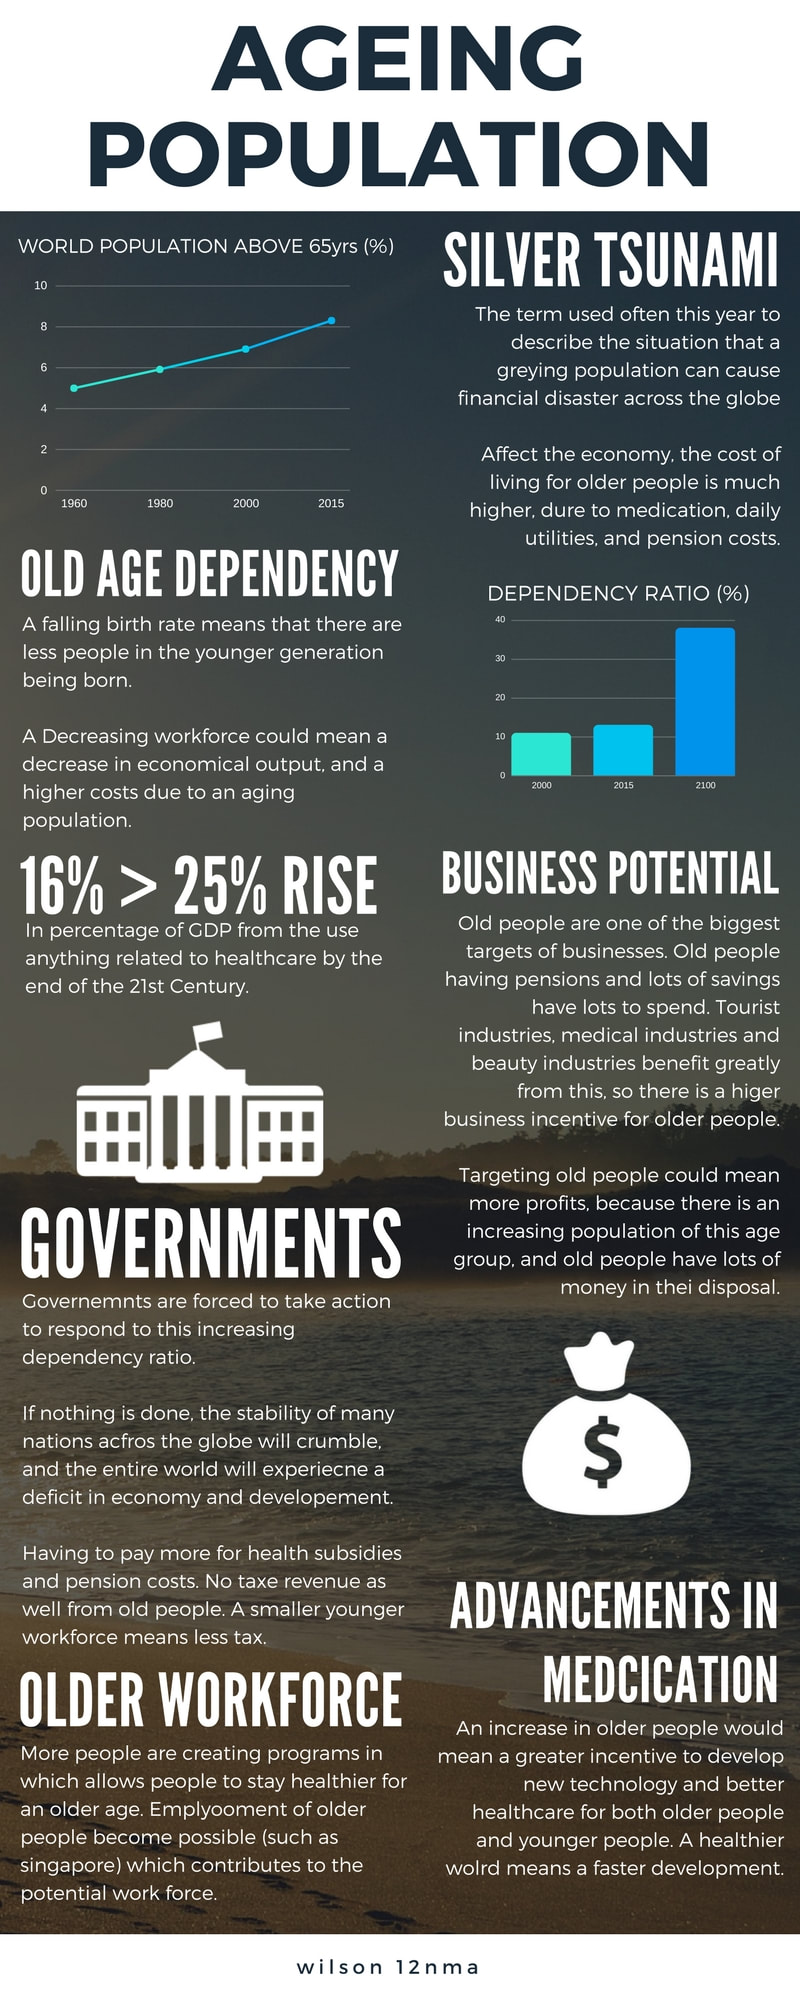
Use the resources below to create an inforgraphic of the possible consequences of ageing populations. Make sure you identify the positives/opportunities as well as the negatives/challenges. Think about SEEP!
Possible infographic making sites
Examples of student infographics
Daily Fail?
Look at the story below about UK population increases. As well as worrying about migration, the journalist says that some of the increases will be because there are more births. Look at the article and consider:
- What are the BLURS?
- How does the data presented in the population pyramid contradict what the journalist says?
