Specification
Uses of water, including agriculture, industry, human hygiene and leisure, and the rising demand for and supply of water: areas of water shortage and water surplus.
1. Water: image interpretation
Examine the photos in the slideshow below.
Choose two that you find particularly striking or interesting. For each:
Choose two that you find particularly striking or interesting. For each:
- Copy it into a doc
- Add annotations of at least five aspects of the photo that you think are important and explain why
- Tell the story of what you think is happening in the photo (what you think - this is an exercise in imagination not research!)
- Use your senses to describe what you would experience if you were there:
- What would you see?
- How would it smell?
- What sounds would you hear?
- What would the people be doing and talking about?
- What are the positives of what is happening inthe photo?
- What problems are being experienced by people/environment?
- How does your photo relate to the uses of water:
- What does it say about why water is important?
- What does it say about how water is used?
- What does it say about issues with water quality and/or water supply around the world?
- What does the photo make you feel? Why?
2. Water Use Infographics
Study each of the infographics and answer the questions above each one.
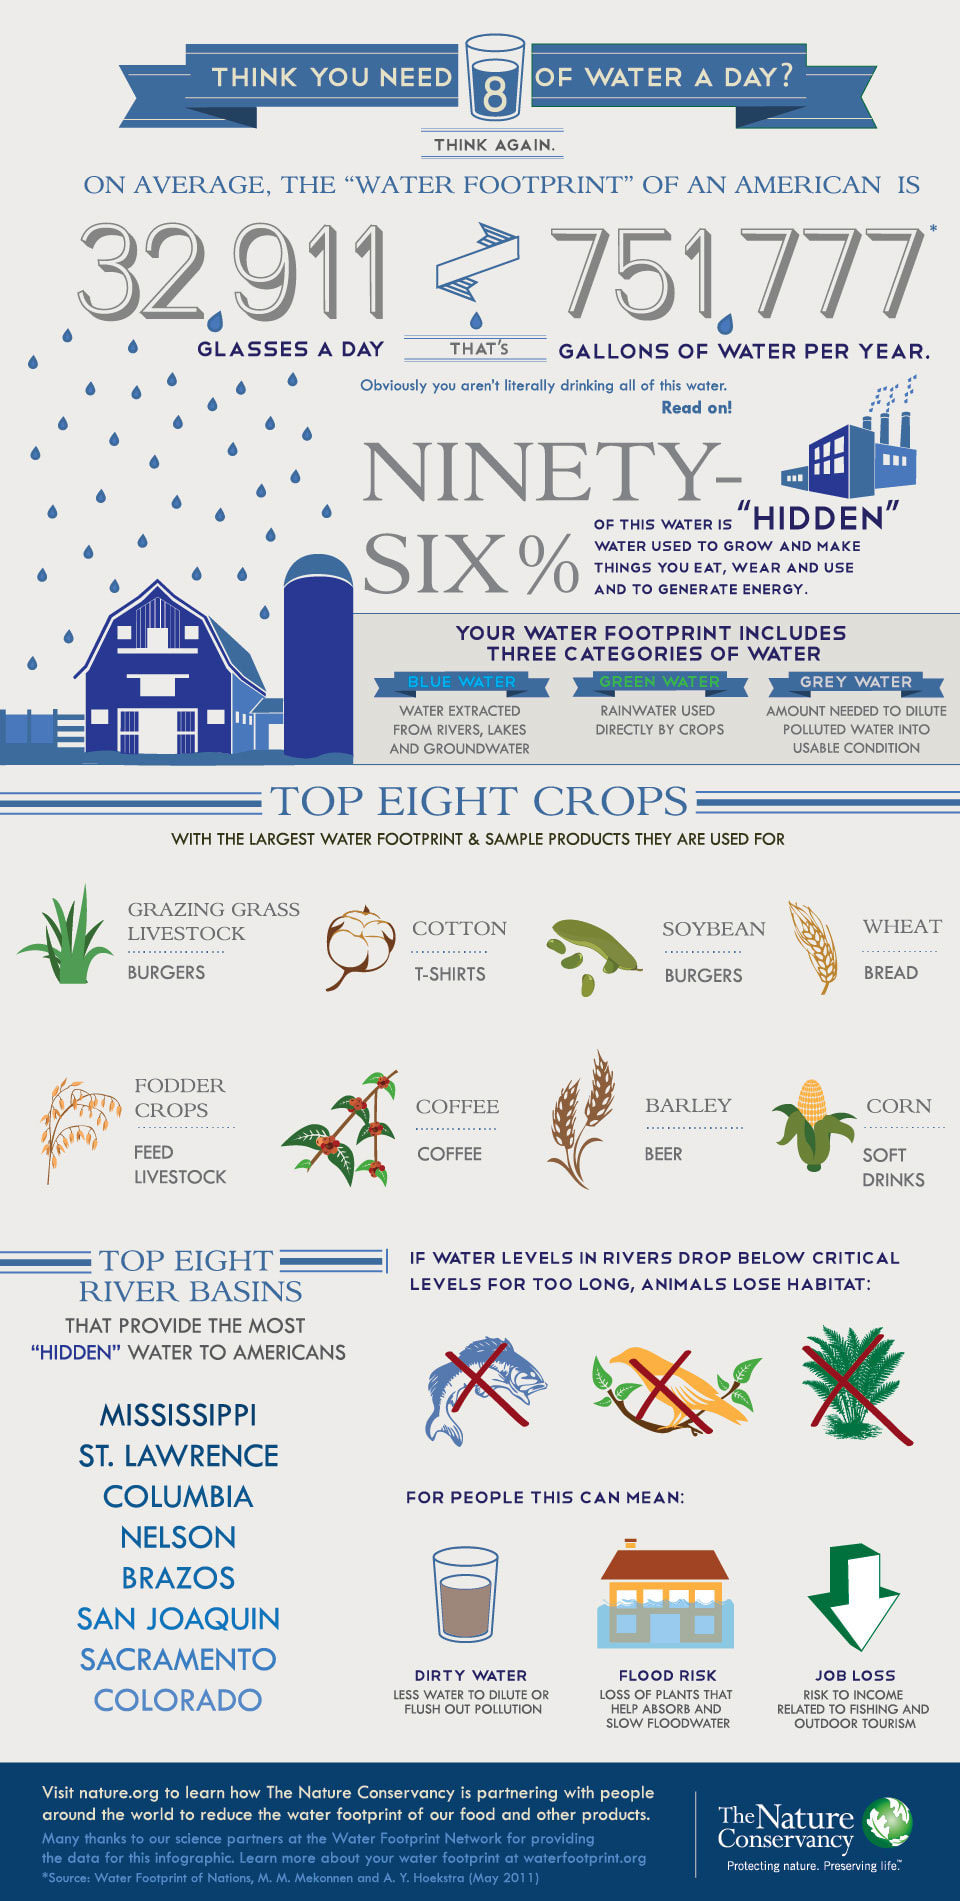
Infographic 1
- How many LITRES of water does the average American use in a year (you'll need to find a way to convert US Gallons to litres)?
- How many litres is that each day?
- If a bucket of water holds about 10 litres of water, how many buckets of water does an average American use each day?
- Comment on this; does it surprise you (it should!)? Why?
- What is meant by "hidden water"?
- What is meant by "Blue water", "Green water" and "Grey Water"?
- What are the problems if water levels fall below critical levels in rivers?
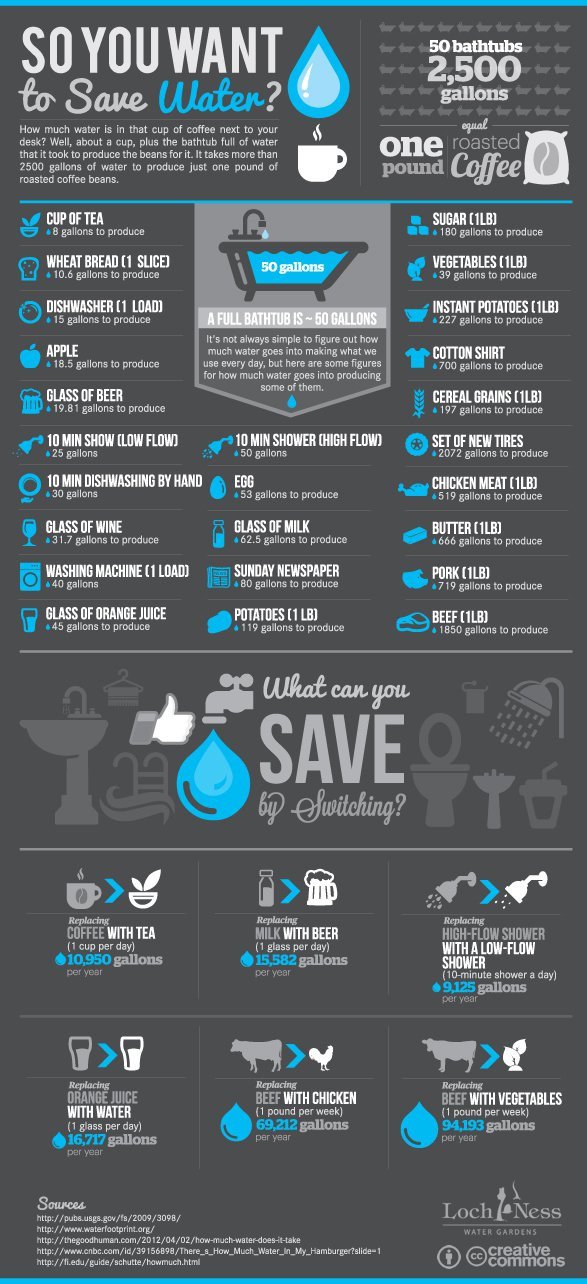
Infographic 2
- Use this infographic to estimate how much water you used yesterday?
Infographic 3
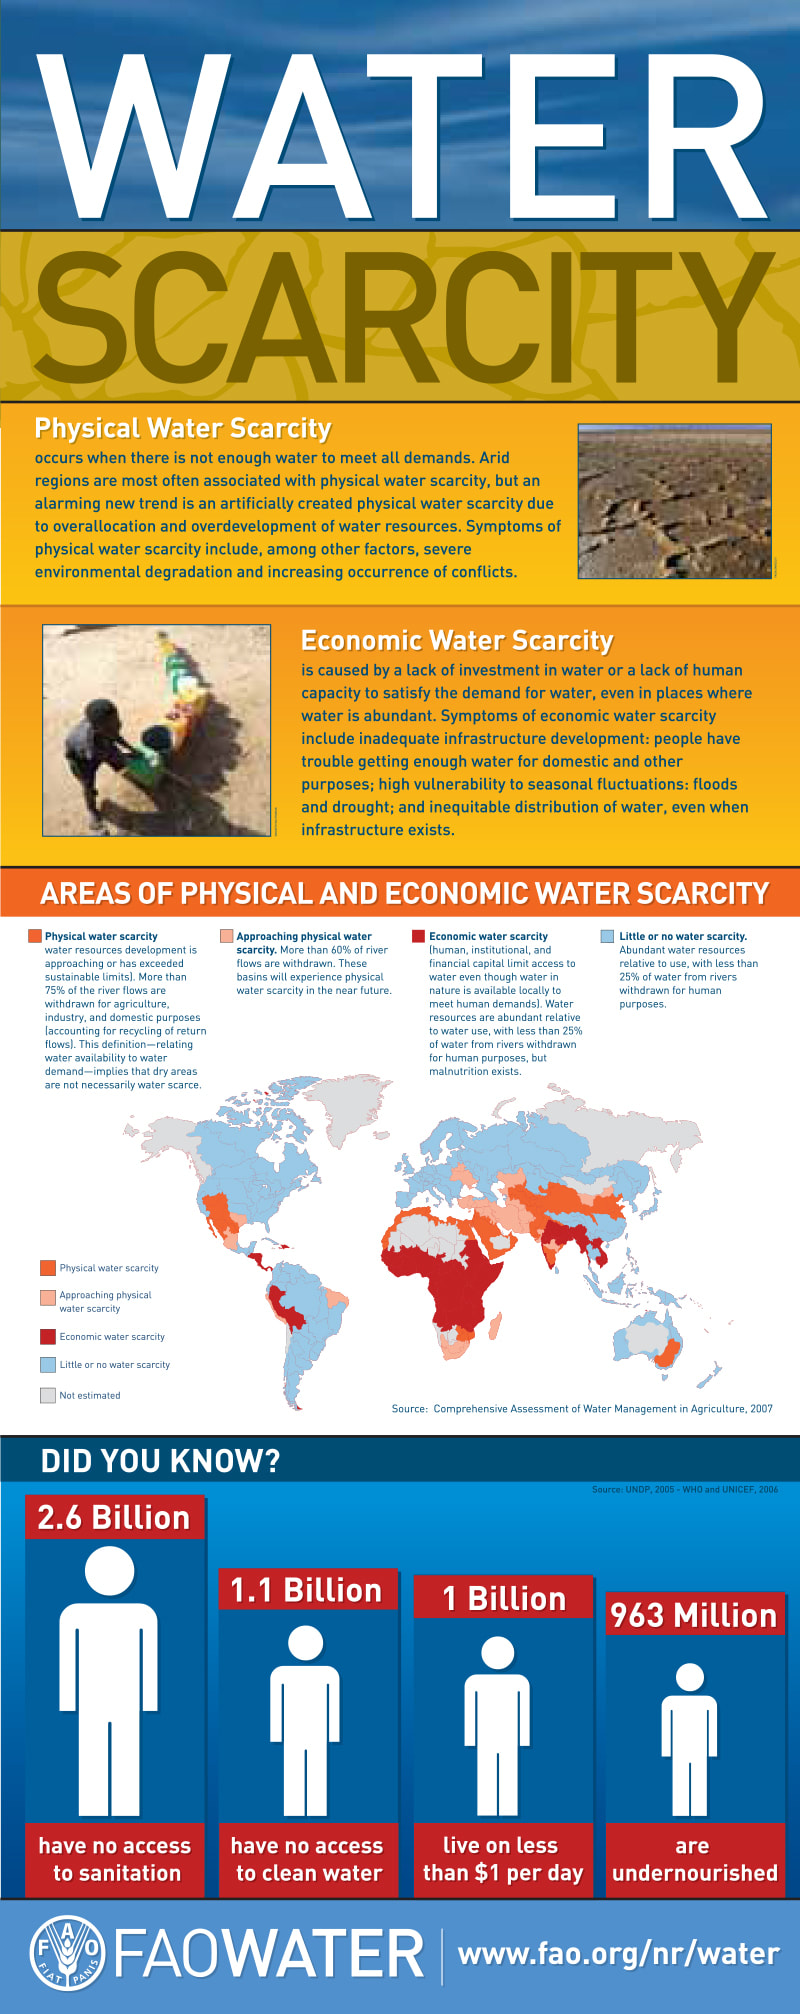
- What is the difference between physical and economic water scarcity?
- Use the world map to describe the patterns of water scarcity around the world. Break it down into:
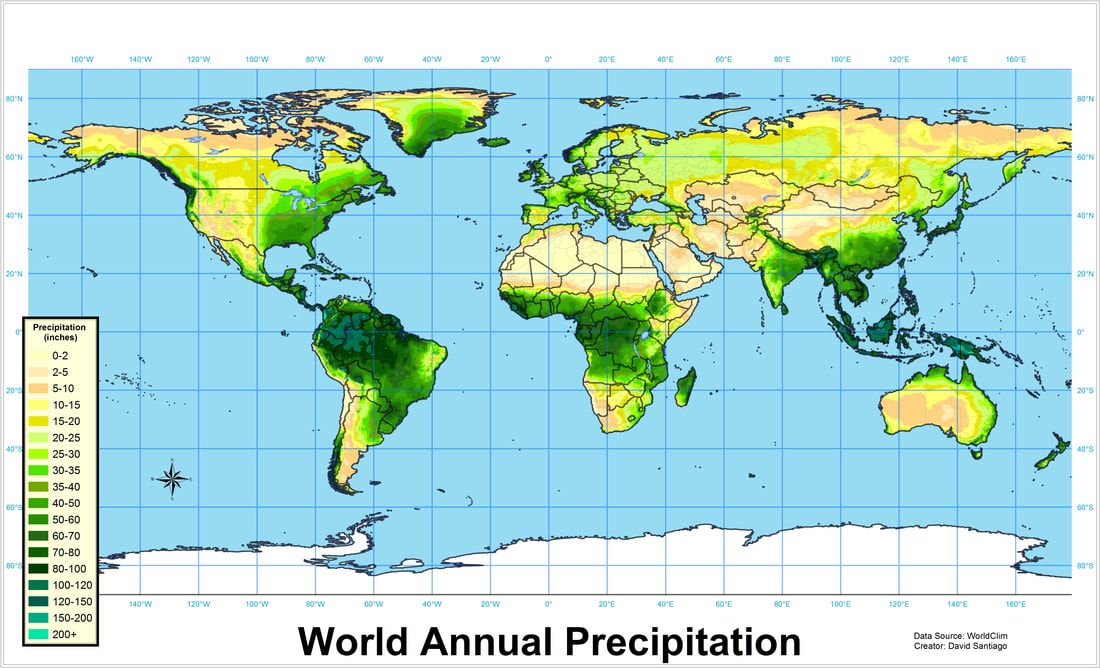
- Which areas of the world experience physical water scarcity? Name countries and continents and consider lines of latitude. Study the map of world precipitation patterns: what do you notice about the level of precipitation in these areas? How does this help to explain the physical water scarcity?
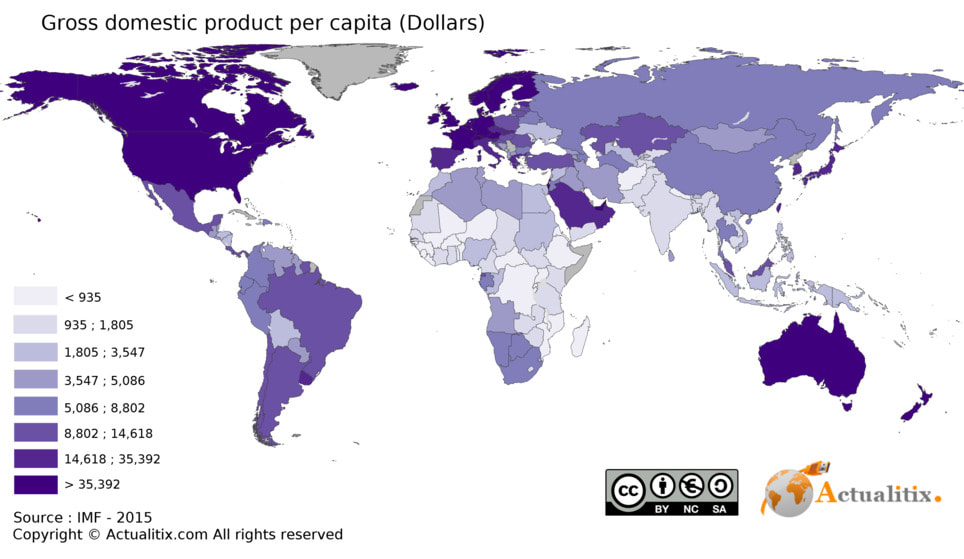
- Which areas of the world experience economic water scarcity? Name countries and continents and consider lines of latitude. Study the maps of world precipitation and wealth: what do you notice? How does this help to explain the physical water scarcity?
- Why do you think the areas in blue do not experience much water scarcity?
- Why are there no estimates for the areas in grey? There is more than one answer here - name areas and suggest a reason.
- Which areas of the world experience physical water scarcity? Name countries and continents and consider lines of latitude. Study the map of world precipitation patterns: what do you notice about the level of precipitation in these areas? How does this help to explain the physical water scarcity?
|
|
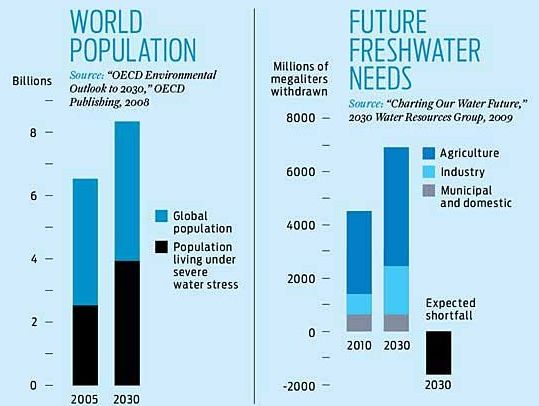
3. Growing demand for water
Use your textbook and the websites below to write 400 words EXACTLY on the reasons why the world demand for water is increasing. You must use all of the sources and then work to include all points within the word limit. It is okay to use tables or diagrams. You must include two or more self drawn graphs (they do not have to be hand drawn but they must be your graphs).