The Subject Guide
- Population change and demographic transition over time including natural increase, fertility rate, life expectancy, population structure and dependency ratios.
- Detailed examples of two or more contrasting countries.
A. Definitions
Demographic transition
This usually refers to the "Demographic Transition Model" but may be used to simply mean changes in population numbers and structure over time.
Crude Birth Rate (CBR)
The number of live births per thousand people in one year.
Crude Death Rate (CDR)
The number of deaths per thousand people in one year.
Natural increase
The increase or decrease in population per thousand people in a year calculated by subtracting the CDR from the CBR. Natural increase occurs when there birth rate is higher than the death rate; natural decrease occurs when the death rate is higher than the birth rate. It is usually expressed per thousand but may also be converted to a percentage.
General Fertility Rate (GFR)
The number of live births per 1,000 females of childbearing age (between the ages of 15-44 years) in a given year.
Total fertility rate (TFR)
The average number of children that would be born per woman if all women lived to the end of their childbearing years and bore children according to a given fertility rate at each age. TFR is a more direct measure of the level of fertility than the crude birth rate, since it refers to births per woman.
Life expectancy
The average number of years to which a person can be expected to live from birth.
The average number of years to which a person can be expected to live from birth.
Population structure
The composition of a population according to the proportion of males and females of different age groups.
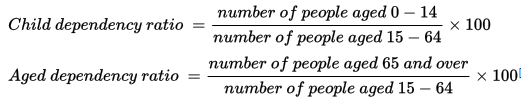
Dependency ratios
Dependents are regarded as those people within a population who are not expected to be economically active. Young dependents are those younger than 15 years. Older dependents are those older than 64. the dependency ratios measure the proportion of dependents to those who are economically active. It is calculated using the formula below:
The composition of a population according to the proportion of males and females of different age groups.
Dependency ratios
Dependents are regarded as those people within a population who are not expected to be economically active. Young dependents are those younger than 15 years. Older dependents are those older than 64. the dependency ratios measure the proportion of dependents to those who are economically active. It is calculated using the formula below:

Dependency ratios can also be calculated for young or old dependency as below:
Doubling time
This is the time that will be taken for the population of a given area to double in size. It is calculated using the "rule of 70" which means that we divide 70 by the rate of natural increase expressed as a percentage.
Population momentum
This explains why population growth can continue even when birth rates/fertility rates fall in populations with a youthful structure. It occurs because a large number of young people will reach maturity and therefore the rate of births will continue to exceed the number deaths even with falling overall fertility. The very simple video below should help!
B. World Population Growth
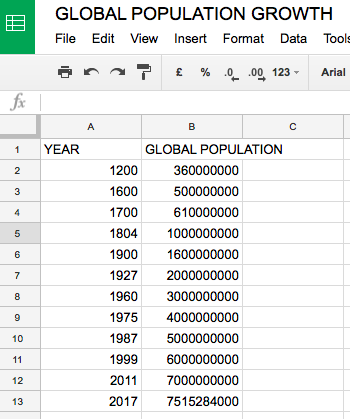
- Use the google sheets file to graph and describe the increase in global population over time.
- How long did it take for the population to grow from:
- 1-2 billion
- 2-3 billion
- 3-4 billion
- 4-5 billion
- 5-6 billion
- 6-7 billion
- What does your answer to Q2 suggest about the rate of increase?
- Use the World Bank data below to explore changes in the total population of China and Niger over the same time period.
C. Changing fertility rates
Use the World Bank data to explore changing world fertility rates from 1960 to present day. Your presentation must include:
1) Overall world data - use the graph tab for this. Remember to identify trends, be specific with data and identify any anomalies.
2) How has fertility changed spatially on a global scale? Use the map and the timeline to examine and describe this. What change can you identify within each continent/region over this period? Use the data bank function to explore the data by examining North America, EU, Southern Asia, Sub-Saharan Africa, East Asia and Pacific.
3) Explore the data for the following countries to support the patterns identified:
- France
- Niger
- China
- Argentina
- Indonesia
D. Changing Life Expectancy
Use the World Bank data to explore changing world life expectancy from 1960 to present day. Your presentation must include:
1) Overall world data - use the graph tab for this. Remember to identify trends, be specific with data and identify any anomalies.
2) How has fertility changed spatially on a global scale? Use the map and the timeline to examine and describe this. What change can you identify within each continent/region over this period? Use the data bank function to explore the data by examining North America, EU, Southern Asia, Sub-Saharan Africa, East Asia and Pacific.
3) Explore the data for the following countries to support the patterns identified:
- France
- Niger
- China
- Argentina
- Indonesia
E. Changing dependency ratios
3 groups:
Use the World Bank data to explore changing world dependency ratios from 1960 to present day. Your presentation must include:
1) Overall world data - use the graph tab for this. Remember to identify trends, be specific with data and identify any anomalies.
2) How has fertility changed spatially on a global scale? Use the map and the timeline to examine and describe this. What change can you identify within each continent/region over this period? Use the data bank function to explore the data by examining North America, EU, Southern Asia, Sub-Saharan Africa, East Asia and Pacific.
3) Explore the data for the following countries to support the patterns identified:
- Group 1: examine Age dependency ratios
- Group 2 examine Age dependency ratios (Old)
- Group 3 examine Age Dependency ratios (Young)
Use the World Bank data to explore changing world dependency ratios from 1960 to present day. Your presentation must include:
1) Overall world data - use the graph tab for this. Remember to identify trends, be specific with data and identify any anomalies.
2) How has fertility changed spatially on a global scale? Use the map and the timeline to examine and describe this. What change can you identify within each continent/region over this period? Use the data bank function to explore the data by examining North America, EU, Southern Asia, Sub-Saharan Africa, East Asia and Pacific.
3) Explore the data for the following countries to support the patterns identified:
- France
- Niger
- China
- Argentina
- Indonesia
F. Population structure
|
|
|
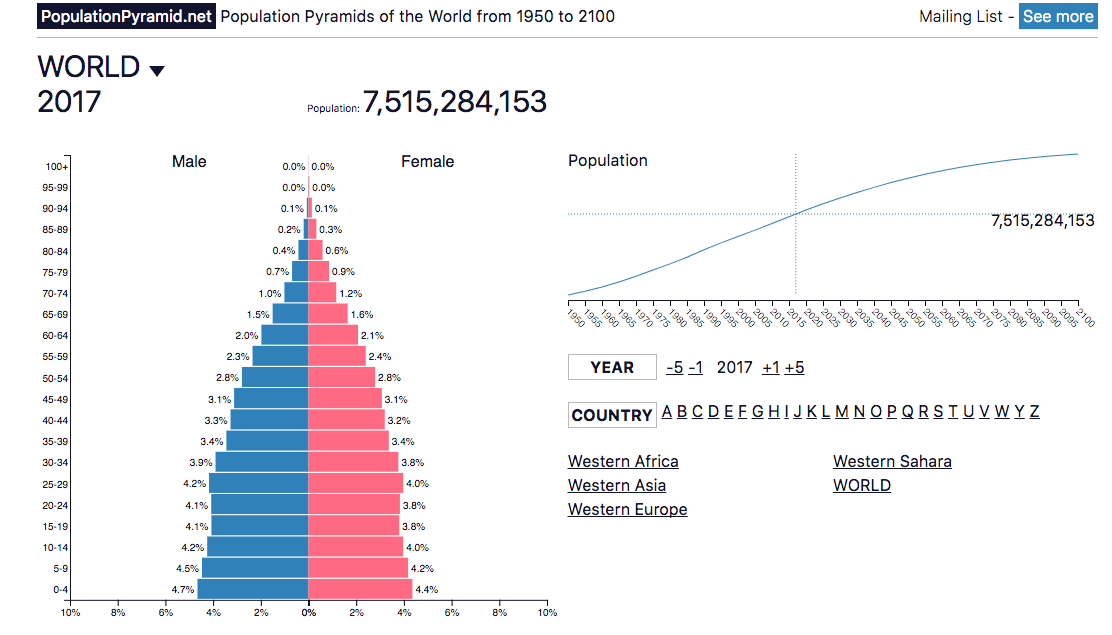
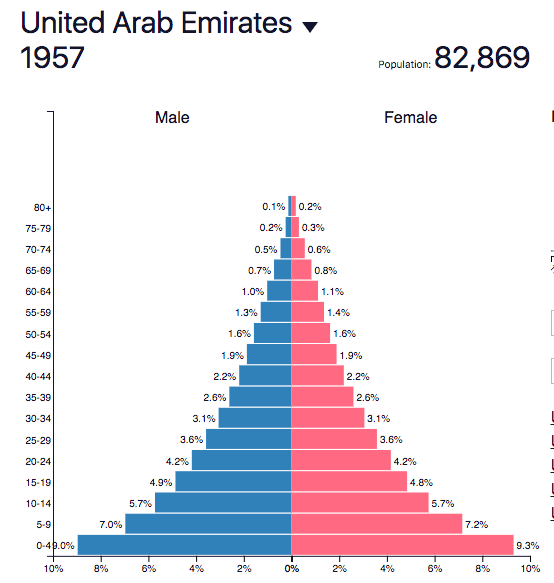
Use the populationpyramid.net website to explore changing global population structures from 1960 to present day. Your presentation must include:
1) Overall world patterns. Focus on key aspect of the pyramids: width of base (indication birth rates), steepness of the pyramid (can give clues about death rates but also show the effects of events eg epidemics, changes in access to contraception, wars, migrations - national scale).
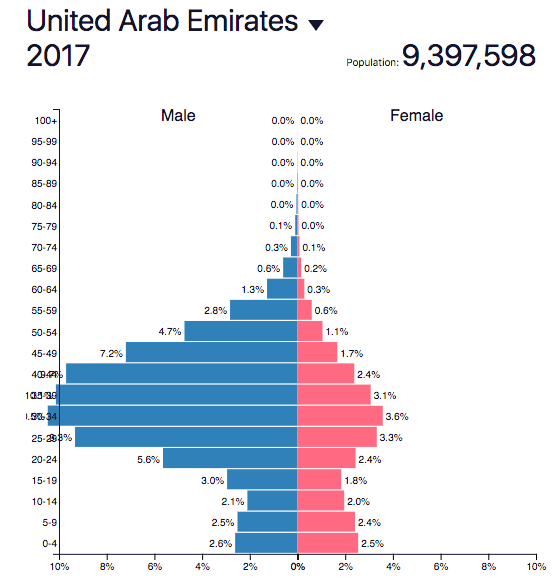
2) Explore the data for the following countries to support the patterns identified:
1) Overall world patterns. Focus on key aspect of the pyramids: width of base (indication birth rates), steepness of the pyramid (can give clues about death rates but also show the effects of events eg epidemics, changes in access to contraception, wars, migrations - national scale).
2) Explore the data for the following countries to support the patterns identified:
- France
- Niger
- China
- Argentina
- Indonesia
|
|
G. The Demographic Transition Model
|
|
|
Draw your own neat copy of the Demographic Transition Model as below. Watch the videos and use your textbook to annotate your graph with the following:
- Characteristics of each stage in birth and death rates and why.
- Examples of countries at each stage and why.
- Which areas of the world are at Stage 5? Why?
- Can you suggest any places on the planet which are still at stage 1? Why is this a difficult task?
- Where on the demographic transition model would you place:
- China
- Niger
- France
- Argentina
- Indonesia
- Where would you place the world on the model? Justify your answer.