GEOGRAPHY MYP/GCSE/DP
  • Home
    • Contact
  • MYP
    • Development >
      • An unequal world?
      • Billionaires investigation
      • Africa: the danger of a single story
      • Patterns of development
      • Trade and development
      • Fair Trade
      • Sustainable Development Goals
    • Tectonic Hazards >
      • What is risk?
      • Alfred Wegener and Continental Drift
      • Plate tectonics
      • Distribution of tectonic hazards
      • Measuring earthquakes
      • Why do people die in earthquakes?
      • School earthquake plan
      • Earthquake assessment
      • Volcanoes - what are they? Why are they important?
      • Volcano "Science Fair"
      • Causes of tsunami
    • Population >
      • Why study population?
      • Population distribution
      • Population growth
      • Population pyramids
      • Demographic transition model
      • Migration
      • Migration examples - case studies
      • Refugees in Indonesia
      • Population revision activities
    • Weather and Climate >
      • Weather vs Climate and why is it important?
      • Climate graphs
      • Why does it rain?
      • What affects temperature and why is Jakarta so hot and wet?
      • What causes wind and how do we measure it?
      • Microclimates
  • IGCSE
    • Course information
    • Physical: Hazardous environments >
      • Distribution of tectonic hazards
      • Causes of tsunami
      • Measuring earthquakes
      • Earthquake case study 1: Haiti
      • Earthquake case study 2: Christchurch
      • Why do earthquakes do more damage in LICs than in HICs?
      • How are volcanic eruptions measured?
      • Tropical storms - distribution
      • Causes of tropical cyclones
      • Tropical cyclones - case study
      • Why live in hazardous areas?
    • River Environments >
      • Hydrological cycle
      • River basins
      • Factors affecting river regimes
      • Fluvial processes: erosion
      • Fluvial processes: weathering and mass movement
      • Fluvial processes: transportation and depositon
      • River features and their formation
      • How rivers change from source to mouth
      • Uses of water
      • Water pollution
      • Water supply
  • IBDP
    • Changing population >
      • Global patterns of economic development
      • Physical and human factors affecting global population distribution
      • Case study 1: China
      • Case study 2: Niger
      • Demographic transition
      • Megacity growth
      • Forced migration and internal displacement
      • Ageing populations
      • Pro-natalist and anti-natalist policies
      • Gender equality policies
      • Trafficking policies
      • The Demographic Dividend
    • Global climate vulnerability and resilience >
      • Atmospheric system
      • The energy balance
      • Changes in the energy balance
      • The enhanced greenhouse effect
      • Climate Change and the Hydrosphere, Atmosphere and Biosphere
      • Impacts of climate change on people and places
      • Disparities in exposure to climate change risk and vulnerability
      • Government-led adaptation and mitigation strategies
      • Civil society and corporate strategies
    • Global resource consumption and security >
      • Progress towards poverty reduction
      • Measuring trends in global consumption
      • Global patterns and trends in the availability and consumption of water
      • Global patterns and trends in the availability and consumption of land/food
      • Global patterns and trends in the availability and consumption of energy
      • Water food and energy nexus
      • Recycling and waste
      • Malthus vs Boserup
      • Resource Stewardship strategies
      • Sustainable Development Goals
    • Freshwater - drainage basins >
      • The drainage basin as a system
      • How rivers change from source to mouth
      • River discharge
      • River processes
      • River landforms
      • Factors affecting flood risk
      • Attempts at flood prediction
      • Flood mitigation
      • Flood mitigation case studies
      • Water scarcity
      • Agricultural activities and water quality
      • Pressures on lakes and aquifers
      • Internationally shared water and conflict
      • Water management: participation of local communities
      • Dams as multi-purpose schemes
      • Water management: Integrated Drainage Basin Management (IDBM)
      • Managing wetlands
    • Leisure, Sport and Tourism >
      • Growth and purpose of leisure time
      • Categories of tourism and sport
      • Economic development and participation
      • Factors affecting personal participation
      • Factors affecting growth of tourism hotspots
      • Spheres of influencee
      • Factors affecting a national sports league
      • Festivals
      • Niche national tourism strategies
      • Role of TNCs
      • Tourism as a national development strategy
      • International sporting events
      • Consequences of unsustainable growth
      • Sustainable tourism
      • Future international tourism
      • Political and cultural influences on sport
    • Extended Essay in Geography >
      • Supervisor meetings
    • Skills/concepts >
      • Infographics
      • 4 Ps
      • Mock examination revision and preparation
  • Geography and ToK
  • Theory of Knowledge
    • Knowledge and Technology
    • Knowledge and Language
    • Knowledge and Politics
    • Knowledge and Religion
    • Knowledge and Indigenous Societies

Economic development and participation in leisure activities

Study Guide

The link between economic development and participation in leisure activities
• Detailed examples to illustrate recent changes in participation for two or more societies at contrasting stages of development

Why would we expect a link between economic development and participation in leisure activities?

1. Greater wealth = more leisure time?

​Study the graph below from the Washington Post.
Picture
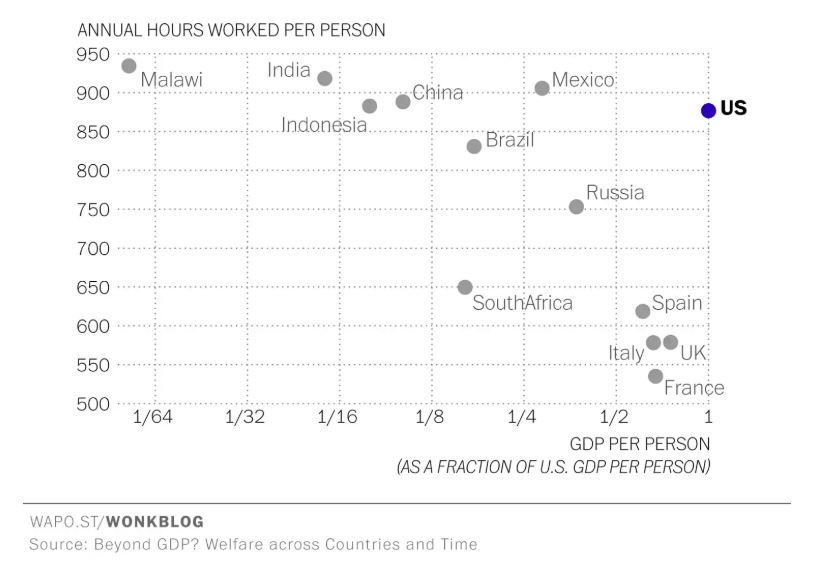
Washington Post 19 February 2016https://www.washingtonpost.com/news/wonk/wp/2016/02/19/richer-countries-have-more-leisure-time-with-one-big-exception/?utm_term=.b18febe1868c
  1. Describe the pattern shown in the graph.
  2. What are the implications of this pattern for the amount of time that people will be able to spend on participation in leisure activities?
  3. Which country is anomalous? Suggest reasons BEFORE reading the article.
  4. Read the article:
    1. What is the main point it makes about the relationship between economic and leisure?
    2. Why is the pattern not always straightforward?


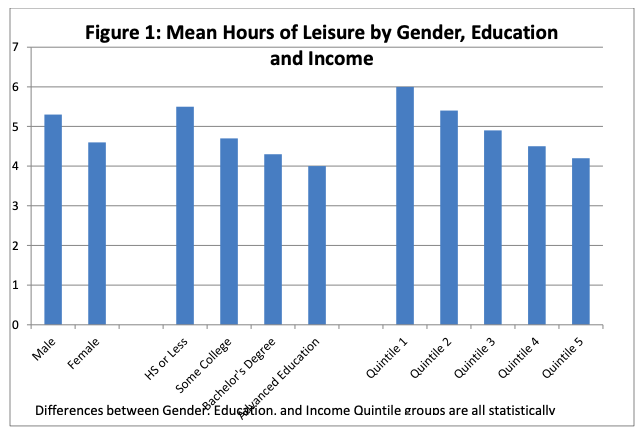
The graph, right, shows average hours of leisure time in the US by gender, education and income.

Describe the patterns shown. What do they say about economic development/wealth and likely participation in leisure activities?
Picture
Gender, Social Class, Leisure and Well-Being: Challenging Leisure as the Holy Grail Marybeth J. Mattingly, University of New Hampshire and Liana C. Sayer, Ohio State University
 

​EXTRA: read THIS article from The Atlantic magazine. Summarise what it reports on leisure time and wealth in the US. Why is this described as a "paradox"?
Picture


2. Personal and national income affects access and choice in leisure activities

Picture

  1. Scattergraph car ownership against GDP per capita.
  2. Briefly describe the pattern shown. what does it say about economic development and car ownership?
  3. Now examine the table below which shows participation in walking, cycling and sport as leisure activities for people with and without car access in the UK. 
    1. What patterns does it show?
    2. Explain possible reasons for these patterns?
    3. Why do you think that car owners are more likely to walk or cycle for leisure purposes?
    4. In what other ways will GDP affect people's ability to make choices about their leisure activities?
Picture
Adult participation in sport Analysis of the Taking Part Survey Helen Jones, Peter Millward (Knight, Kavanagh and Page) and Babatunde Buraimo (University Of Central Lancashire) August 2011
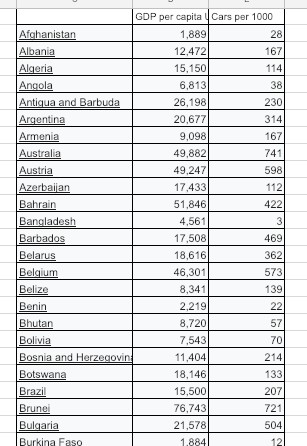
4. Examine the leisure activities below. In pairs, choose four and explain how people's likelihood of participating will be influenced by the level of economic development of their home country and by personal wealth.

5. Describe and explain the patterns shown in the graph on the right which shows participation in sport in the US.
​
Picture
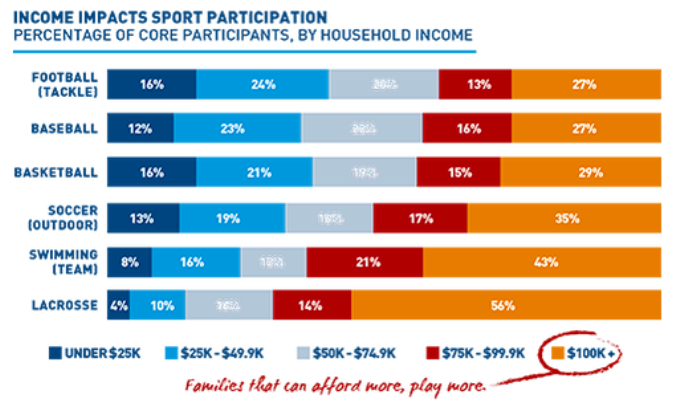
https://www.aspeninstitute.org/blog-posts/7-charts-that-show-the-state-of-youth-sports-in-the-us-and-why-it-matters/
Picture
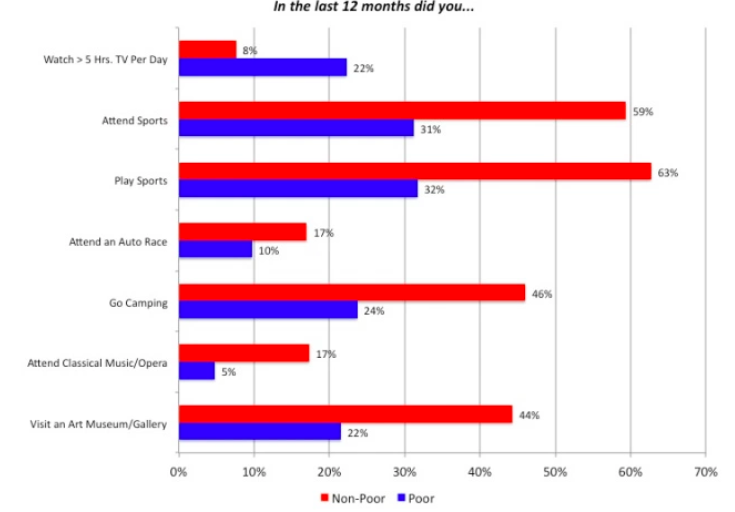
https://inequalitiesblog.wordpress.com/2011/07/07/leisure-inequality-%E2%80%93-what-do-the-poor-and-non-poor-do-for-fun/amp/

The graph on the left is based upon questions about leisure activities asked of adult respondents to the United States general social survey (GSS) since the 1990s.
  1. What does it suggest about overall participation in most leisure activities by wealth?
  2. Which leisure activity is more likely to be done by "poor" than "non-poor"? Suggest reasons?

EXTRA: read the blogpost on the right (remember - it is a blog post so just one person's opinion). Consider:
  • Do you agree with the views of the writer?
  • What negative stereotypes can you find in the post? Is it possible that stereotypes might affect people's leisure choices?
  • To what extent do you agree that our leisure choices are influenced or even governed by socio-economic factors?
Picture

3. Other socio-economic factors

 The diagram below shows some suggested factors affecting demand for tourism. Examine them carefully and establish which you believe are:
  1. Directly caused by the level of economic development of a country or region.
  2. Indirectly caused by level of economic development.
  3. Connected to personal wealth and status.
  4. Unconnected to economic factors.
Picture
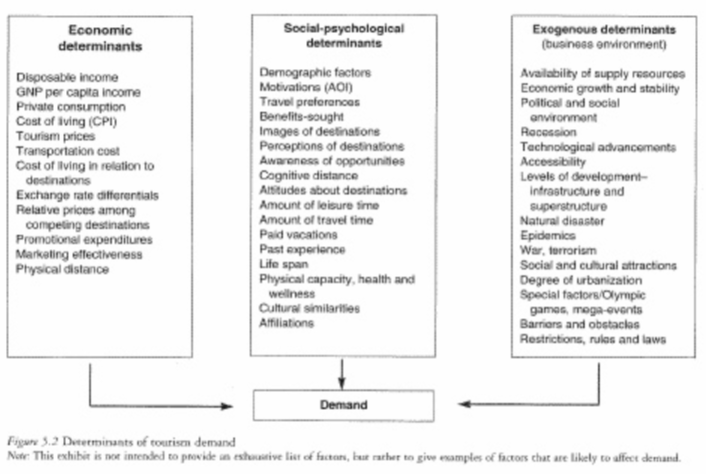
The determinants of tourism demand by Uysaal, M. (Chapter in "The Economic Development of the Tourism Industry: a supply side analysis" ed Ionnides & Debbage. Routlege, 1998.https://www.academia.edu/8602157/The_determinants_of_tourism_demand

Example 1: Tourism growth and development in China 

Study the resources below which show the rise of the middle class in China. First, make sure you remember the work we have already done on the emergence of the global middle class. 
  1. Study the graph on the left and identify the most significant changes shown. Use data to describe the changes.
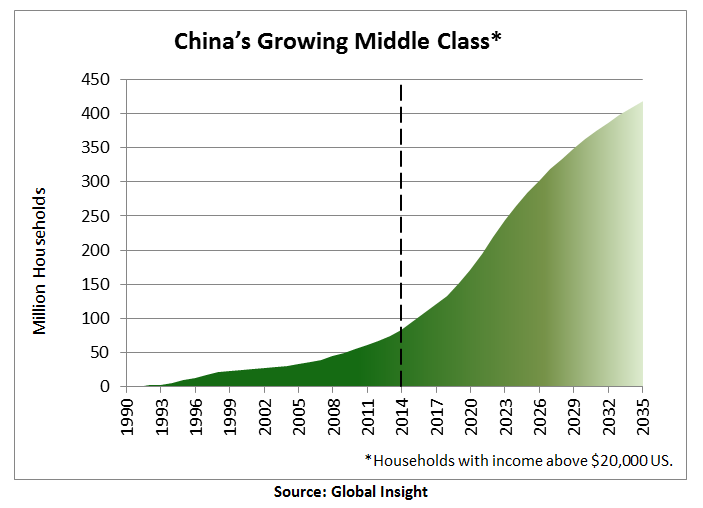
  2. Now study the graph on the right. Again describe the pattern of change using data to support your answer.
  3. What can we infer from this data on the amount of disposable income available to these middle class and especially upper middle class people?
  4. How would we expect this to affect their participation in leisure and tourism activities?
Picture
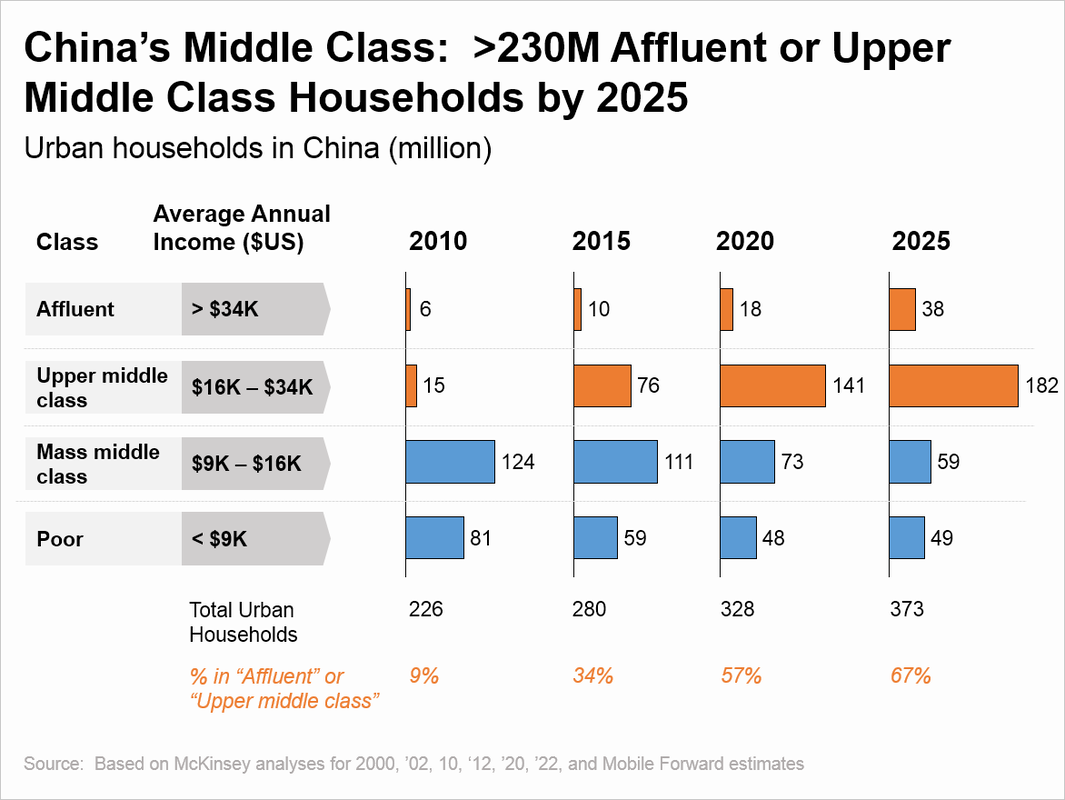
Fromvhttp://mobileforward.net/2015/04/28/iphone-growth-engine-china-middle-class/
Picture
https://www.fas.usda.gov/data/money-does-grow-trees-us-forest-product-exports-set-record

​
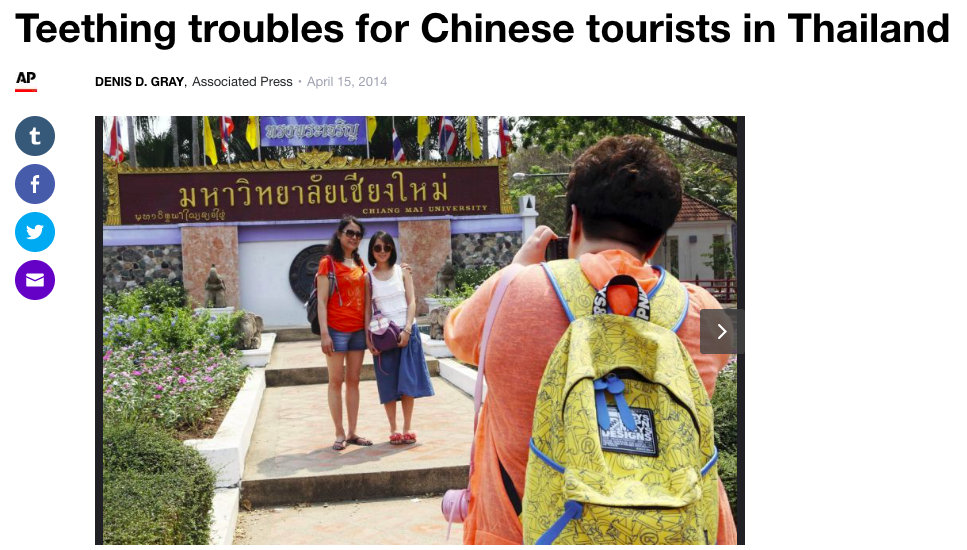
Next watch the video clip below. Identify:
  • Three key points
  • Two important statistics on leisure participation amongst Chinese people
  • One interesting fact or aspect of the story
​

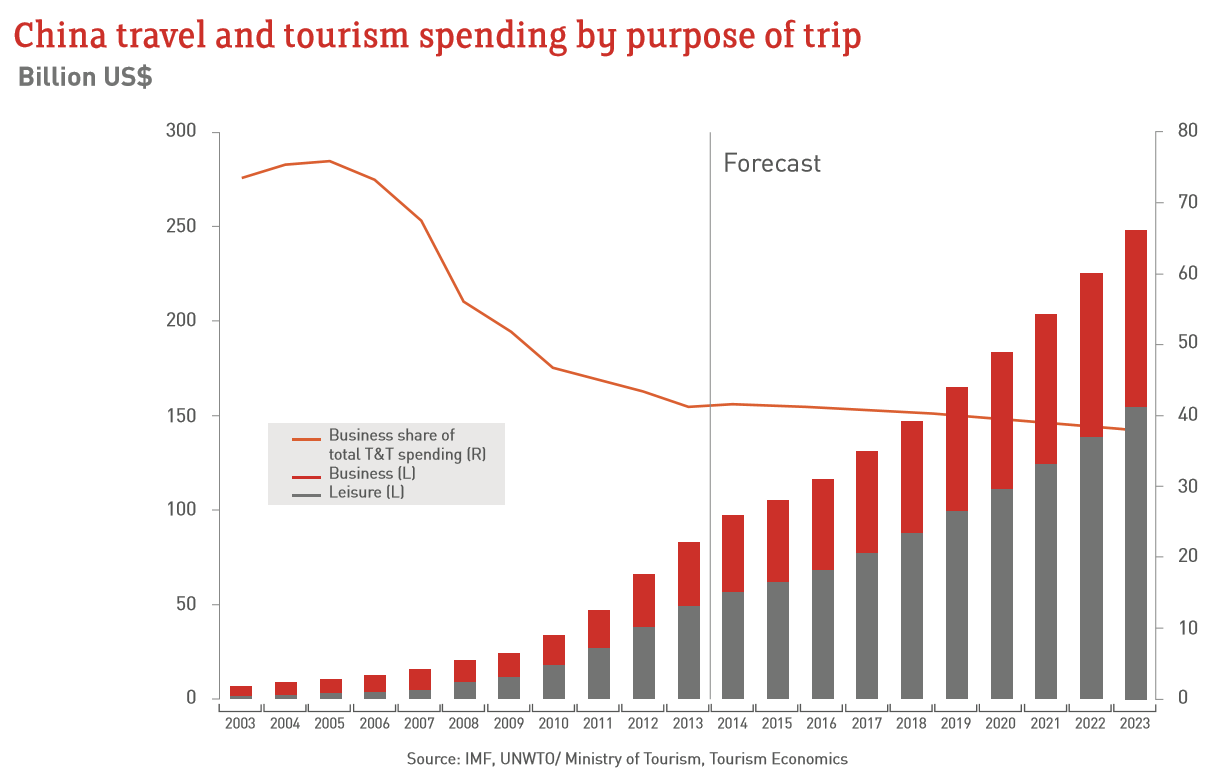
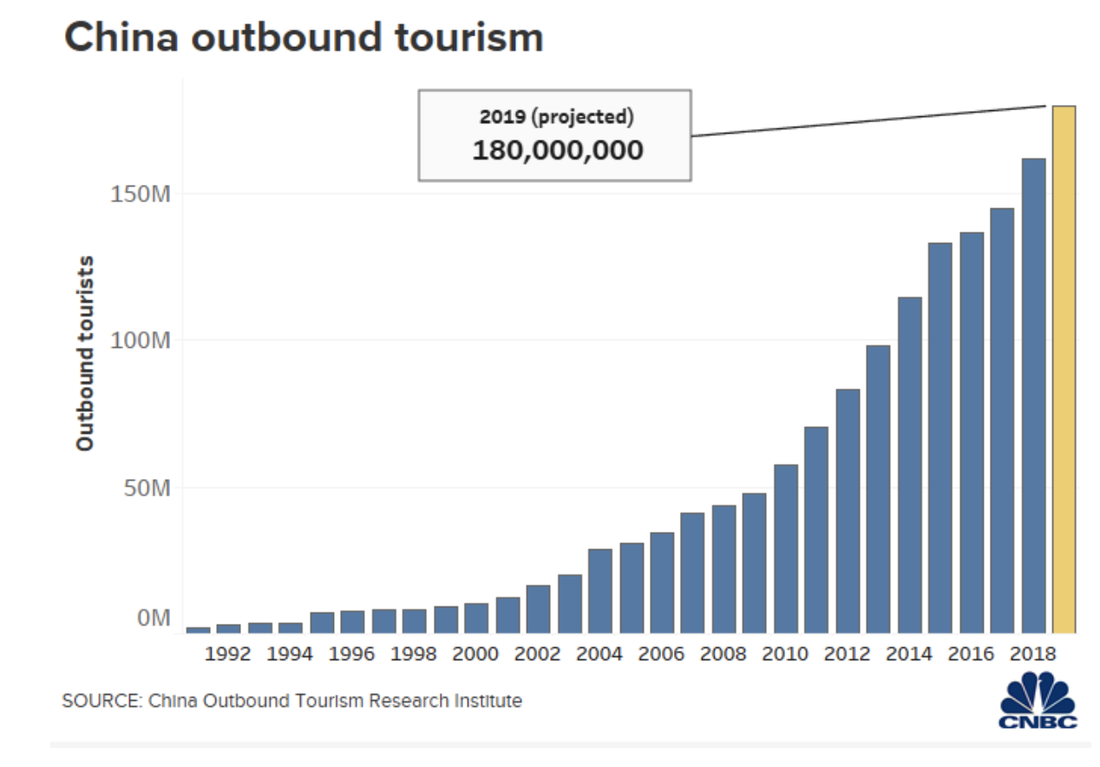
Now examine the resources below.
  1. Start with the graph on the left. What does the line graph show? What pattern is shown? Try to explain why.
  2. Now study the stacked bar graphs. What patterns are shown? Explain the change in both business and leisure trips.
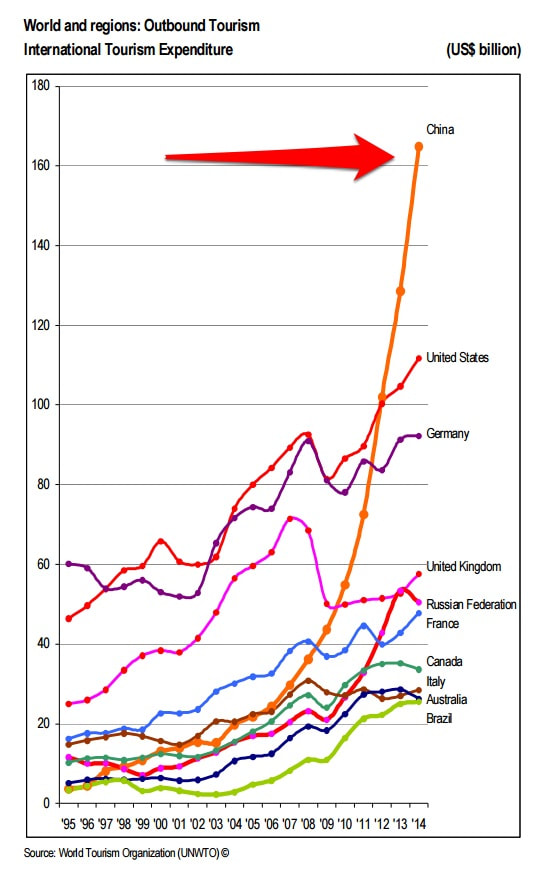
  3. From the graph on the right, describe the pattern of growth in outbound tourism from China between 1996 and 2014. Use data to compare the rate of growth in outbound tourism from China with the other countries shown. Explain the patterns.
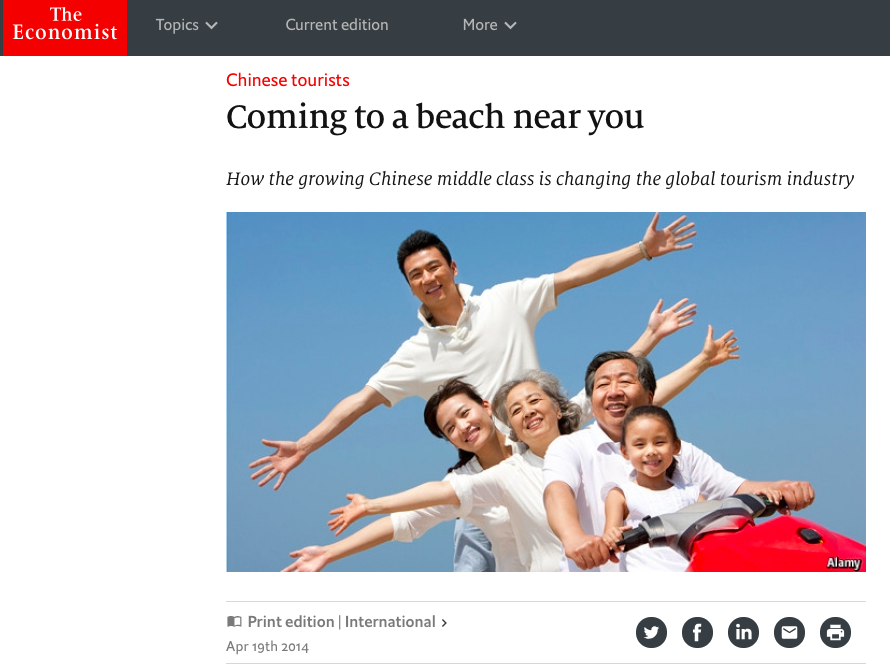
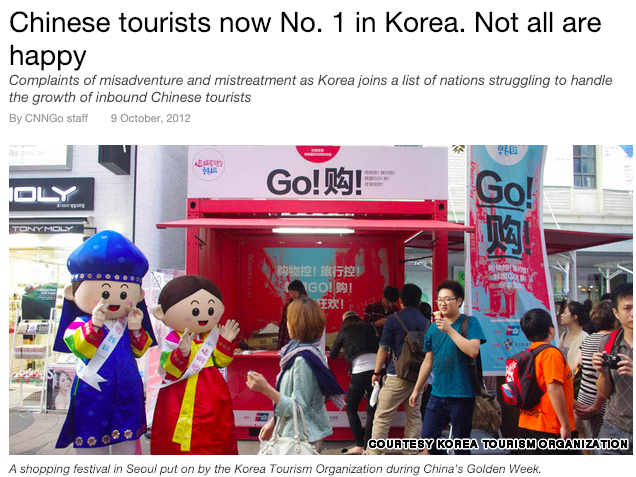
  4. Now read the two articles (the images are hyperlinked). Use these to add depth and detail to your explanation of the patterns shown and the reason for the huge increase in tourism in China.
​
Picture
https://seekingalpha.com/article/3962028-chinas-outbound-tourism-boom-invest
Picture
Picture
Picture
Picture
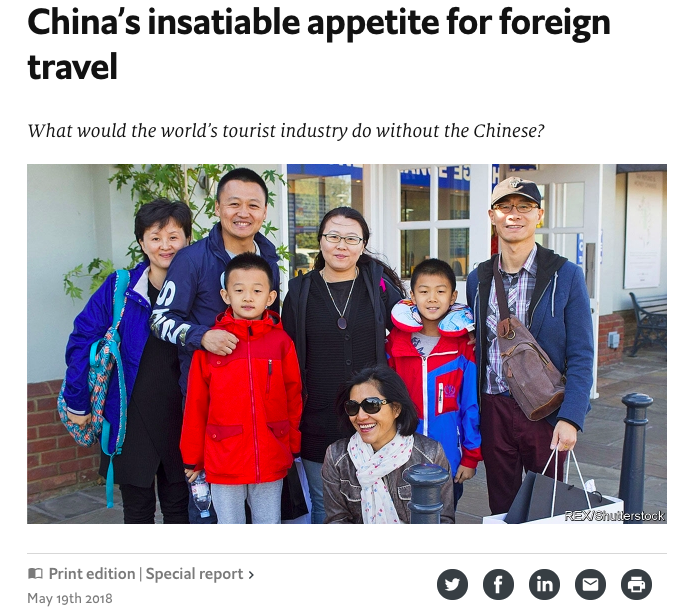
Economist Special Edition, May 2018 https://www.economist.com/special-report/2018/05/19/chinas-insatiable-appetite-for-foreign-travel
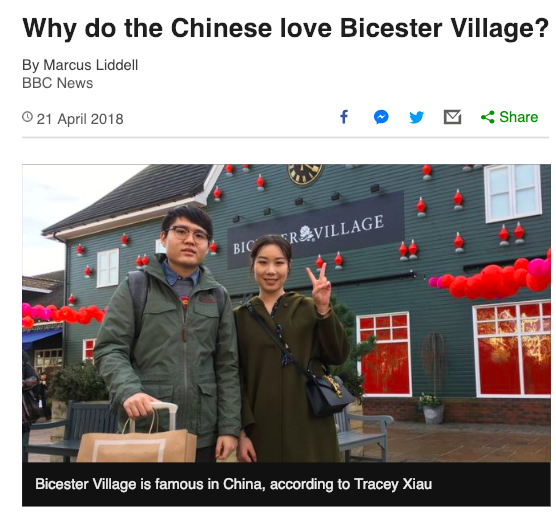
Finally, consider some of the positive and negative consequences of the huge growth in Chinese tourism. Examine the resources below and create a simple SWOT analysis of the impacts that this changes in participation in leisure has had in and out of China.
Picture
Picture
Picture
Picture
Picture
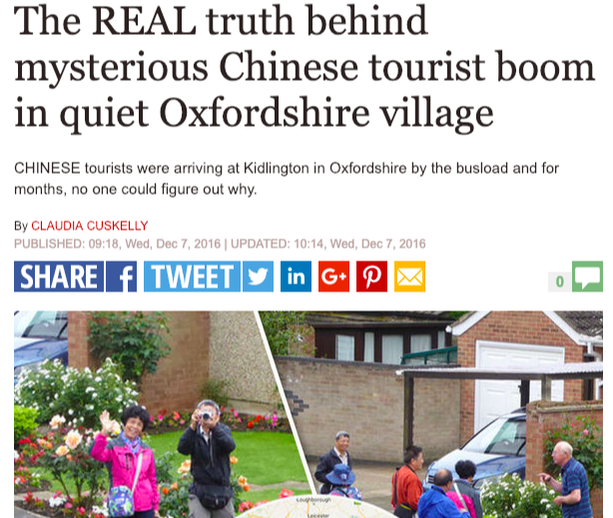
Daily Express 7 December 2016
Picture


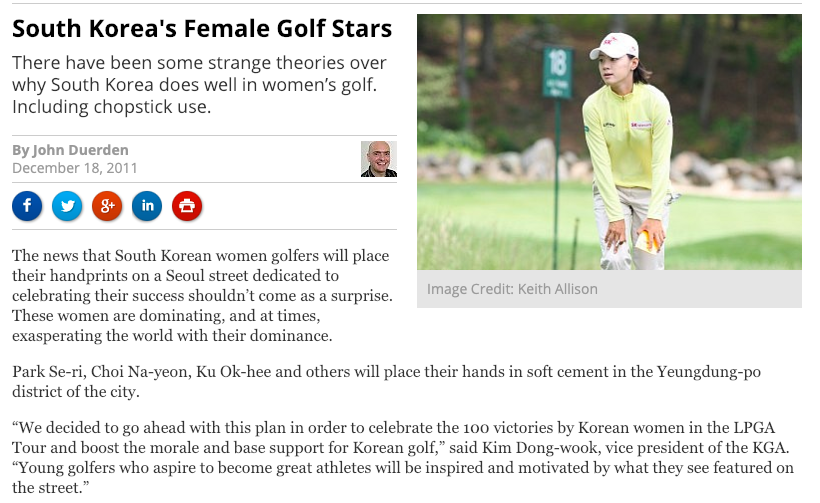
Example 2: Female golfers in South Korea


Study the two graphs below:
  1. Describe with data the changes in GDP per capita in South Korea from 1910 to the present. What can we infer from this about personal income and availability of leisure choices?
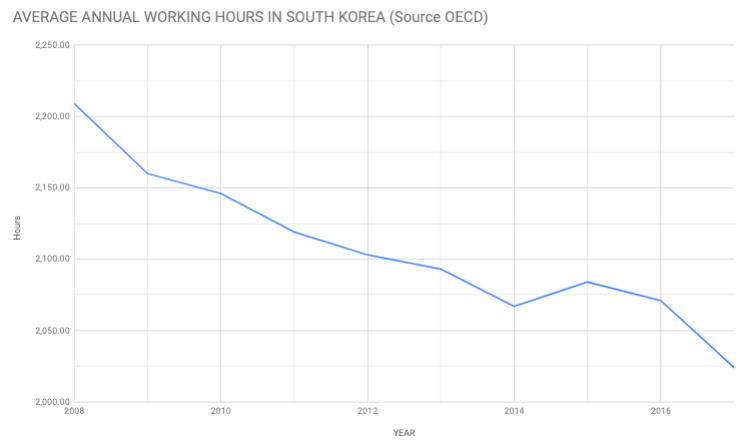
  2. The second graph shows changes in the the average number of annual working hours in South Korea. Working hours in South Korea are high compared to most OECD countries but area falling rapidly.
    1. Describe how working hours in South Korea have changed since 2009. What implications does this have for leisure time in the country? 
Picture


​
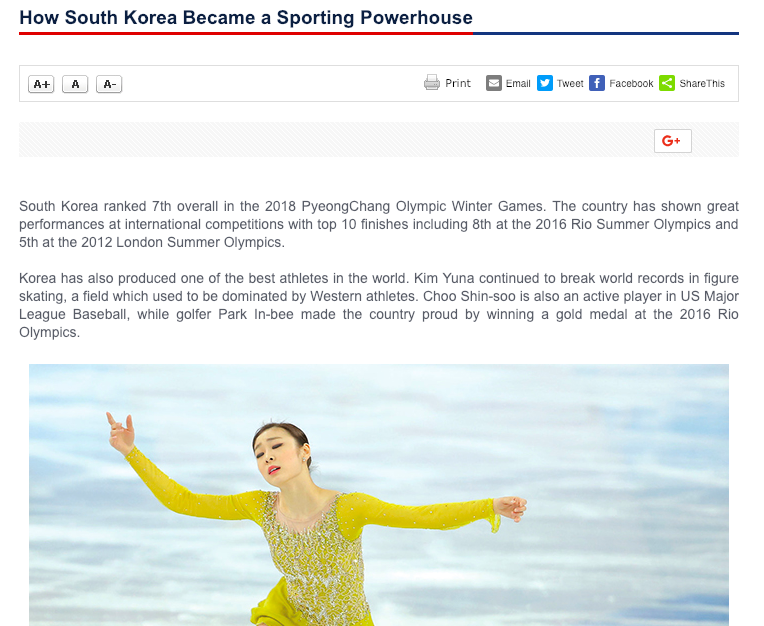
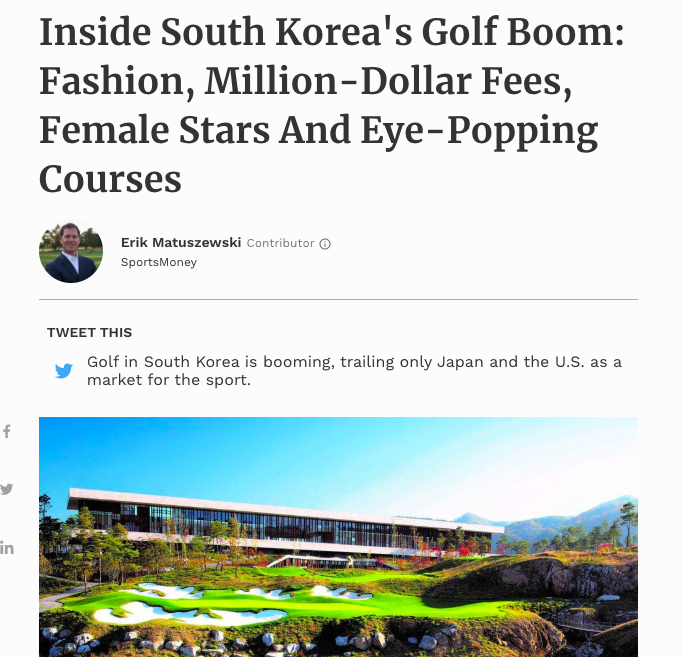
Read the article of the right and identify the role played by each of the following in developing South Korea as a sporting nation:
  • people's attitude to sport
  • Government spending
  • Training facilities
  • domestic competitions
  • professional facilities
  • neighbourhood sports clubs
How does each of these link to economic development?
Picture
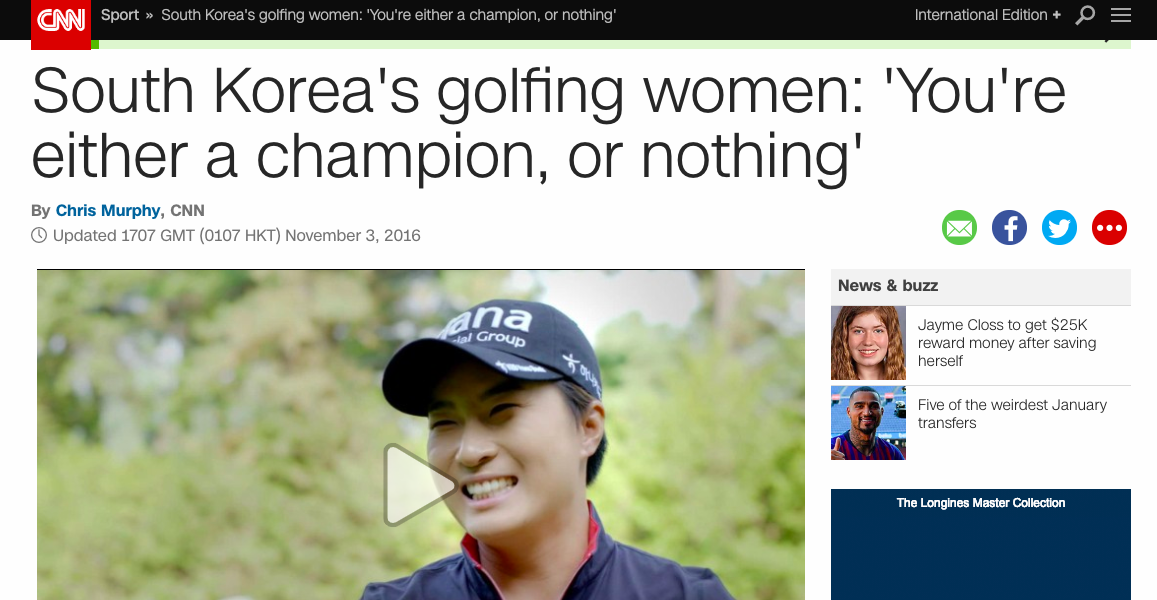
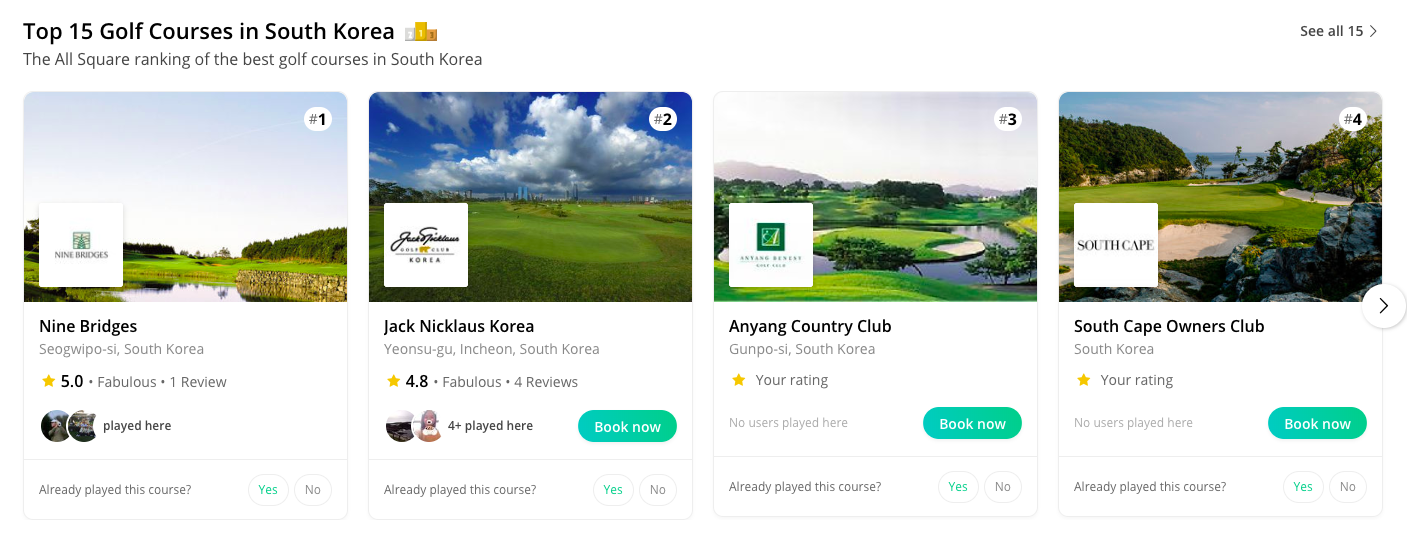
Watch the video and examine the website below. What factors do you think have led to the growth of golfing in South Korea and to the success of Korean players? Consider:
  • investment
  • quality of courses
  • growth of a golfing culture 
  • culture and attitudes to golf
  • media presentation
Picture
Picture
Picture
Picture

Finally, examine the resources below and identify the factors which have made golf so attractive to South Korean women.
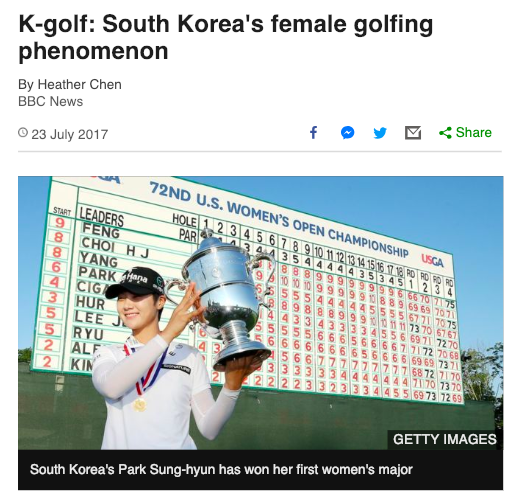
Picture
Picture
Picture
  • Home
    • Contact
  • MYP
    • Development >
      • An unequal world?
      • Billionaires investigation
      • Africa: the danger of a single story
      • Patterns of development
      • Trade and development
      • Fair Trade
      • Sustainable Development Goals
    • Tectonic Hazards >
      • What is risk?
      • Alfred Wegener and Continental Drift
      • Plate tectonics
      • Distribution of tectonic hazards
      • Measuring earthquakes
      • Why do people die in earthquakes?
      • School earthquake plan
      • Earthquake assessment
      • Volcanoes - what are they? Why are they important?
      • Volcano "Science Fair"
      • Causes of tsunami
    • Population >
      • Why study population?
      • Population distribution
      • Population growth
      • Population pyramids
      • Demographic transition model
      • Migration
      • Migration examples - case studies
      • Refugees in Indonesia
      • Population revision activities
    • Weather and Climate >
      • Weather vs Climate and why is it important?
      • Climate graphs
      • Why does it rain?
      • What affects temperature and why is Jakarta so hot and wet?
      • What causes wind and how do we measure it?
      • Microclimates
  • IGCSE
    • Course information
    • Physical: Hazardous environments >
      • Distribution of tectonic hazards
      • Causes of tsunami
      • Measuring earthquakes
      • Earthquake case study 1: Haiti
      • Earthquake case study 2: Christchurch
      • Why do earthquakes do more damage in LICs than in HICs?
      • How are volcanic eruptions measured?
      • Tropical storms - distribution
      • Causes of tropical cyclones
      • Tropical cyclones - case study
      • Why live in hazardous areas?
    • River Environments >
      • Hydrological cycle
      • River basins
      • Factors affecting river regimes
      • Fluvial processes: erosion
      • Fluvial processes: weathering and mass movement
      • Fluvial processes: transportation and depositon
      • River features and their formation
      • How rivers change from source to mouth
      • Uses of water
      • Water pollution
      • Water supply
  • IBDP
    • Changing population >
      • Global patterns of economic development
      • Physical and human factors affecting global population distribution
      • Case study 1: China
      • Case study 2: Niger
      • Demographic transition
      • Megacity growth
      • Forced migration and internal displacement
      • Ageing populations
      • Pro-natalist and anti-natalist policies
      • Gender equality policies
      • Trafficking policies
      • The Demographic Dividend
    • Global climate vulnerability and resilience >
      • Atmospheric system
      • The energy balance
      • Changes in the energy balance
      • The enhanced greenhouse effect
      • Climate Change and the Hydrosphere, Atmosphere and Biosphere
      • Impacts of climate change on people and places
      • Disparities in exposure to climate change risk and vulnerability
      • Government-led adaptation and mitigation strategies
      • Civil society and corporate strategies
    • Global resource consumption and security >
      • Progress towards poverty reduction
      • Measuring trends in global consumption
      • Global patterns and trends in the availability and consumption of water
      • Global patterns and trends in the availability and consumption of land/food
      • Global patterns and trends in the availability and consumption of energy
      • Water food and energy nexus
      • Recycling and waste
      • Malthus vs Boserup
      • Resource Stewardship strategies
      • Sustainable Development Goals
    • Freshwater - drainage basins >
      • The drainage basin as a system
      • How rivers change from source to mouth
      • River discharge
      • River processes
      • River landforms
      • Factors affecting flood risk
      • Attempts at flood prediction
      • Flood mitigation
      • Flood mitigation case studies
      • Water scarcity
      • Agricultural activities and water quality
      • Pressures on lakes and aquifers
      • Internationally shared water and conflict
      • Water management: participation of local communities
      • Dams as multi-purpose schemes
      • Water management: Integrated Drainage Basin Management (IDBM)
      • Managing wetlands
    • Leisure, Sport and Tourism >
      • Growth and purpose of leisure time
      • Categories of tourism and sport
      • Economic development and participation
      • Factors affecting personal participation
      • Factors affecting growth of tourism hotspots
      • Spheres of influencee
      • Factors affecting a national sports league
      • Festivals
      • Niche national tourism strategies
      • Role of TNCs
      • Tourism as a national development strategy
      • International sporting events
      • Consequences of unsustainable growth
      • Sustainable tourism
      • Future international tourism
      • Political and cultural influences on sport
    • Extended Essay in Geography >
      • Supervisor meetings
    • Skills/concepts >
      • Infographics
      • 4 Ps
      • Mock examination revision and preparation
  • Geography and ToK
  • Theory of Knowledge
    • Knowledge and Technology
    • Knowledge and Language
    • Knowledge and Politics
    • Knowledge and Religion
    • Knowledge and Indigenous Societies