GEOGRAPHY MYP/GCSE/DP
  • Home
    • Contact
  • MYP
    • Development >
      • An unequal world?
      • Billionaires investigation
      • Africa: the danger of a single story
      • Patterns of development
      • Trade and development
      • Fair Trade
      • Sustainable Development Goals
    • Tectonic Hazards >
      • What is risk?
      • Alfred Wegener and Continental Drift
      • Plate tectonics
      • Distribution of tectonic hazards
      • Measuring earthquakes
      • Why do people die in earthquakes?
      • School earthquake plan
      • Earthquake assessment
      • Volcanoes - what are they? Why are they important?
      • Volcano "Science Fair"
      • Causes of tsunami
    • Population >
      • Why study population?
      • Population distribution
      • Population growth
      • Population pyramids
      • Demographic transition model
      • Migration
      • Migration examples - case studies
      • Refugees in Indonesia
      • Population revision activities
    • Weather and Climate >
      • Weather vs Climate and why is it important?
      • Climate graphs
      • Why does it rain?
      • What affects temperature and why is Jakarta so hot and wet?
      • What causes wind and how do we measure it?
      • Microclimates
  • IGCSE
    • Course information
    • Physical: Hazardous environments >
      • Distribution of tectonic hazards
      • Causes of tsunami
      • Measuring earthquakes
      • Earthquake case study 1: Haiti
      • Earthquake case study 2: Christchurch
      • Why do earthquakes do more damage in LICs than in HICs?
      • How are volcanic eruptions measured?
      • Tropical storms - distribution
      • Causes of tropical cyclones
      • Tropical cyclones - case study
      • Why live in hazardous areas?
    • River Environments >
      • Hydrological cycle
      • River basins
      • Factors affecting river regimes
      • Fluvial processes: erosion
      • Fluvial processes: weathering and mass movement
      • Fluvial processes: transportation and depositon
      • River features and their formation
      • How rivers change from source to mouth
      • Uses of water
      • Water pollution
      • Water supply
  • IBDP
    • Changing population >
      • Global patterns of economic development
      • Physical and human factors affecting global population distribution
      • Case study 1: China
      • Case study 2: Niger
      • Demographic transition
      • Megacity growth
      • Forced migration and internal displacement
      • Ageing populations
      • Pro-natalist and anti-natalist policies
      • Gender equality policies
      • Trafficking policies
      • The Demographic Dividend
    • Global climate vulnerability and resilience >
      • Atmospheric system
      • The energy balance
      • Changes in the energy balance
      • The enhanced greenhouse effect
      • Climate Change and the Hydrosphere, Atmosphere and Biosphere
      • Impacts of climate change on people and places
      • Disparities in exposure to climate change risk and vulnerability
      • Government-led adaptation and mitigation strategies
      • Civil society and corporate strategies
    • Global resource consumption and security >
      • Progress towards poverty reduction
      • Measuring trends in global consumption
      • Global patterns and trends in the availability and consumption of water
      • Global patterns and trends in the availability and consumption of land/food
      • Global patterns and trends in the availability and consumption of energy
      • Water food and energy nexus
      • Recycling and waste
      • Malthus vs Boserup
      • Resource Stewardship strategies
      • Sustainable Development Goals
    • Freshwater - drainage basins >
      • The drainage basin as a system
      • How rivers change from source to mouth
      • River discharge
      • River processes
      • River landforms
      • Factors affecting flood risk
      • Attempts at flood prediction
      • Flood mitigation
      • Flood mitigation case studies
      • Water scarcity
      • Agricultural activities and water quality
      • Pressures on lakes and aquifers
      • Internationally shared water and conflict
      • Water management: participation of local communities
      • Dams as multi-purpose schemes
      • Water management: Integrated Drainage Basin Management (IDBM)
      • Managing wetlands
    • Leisure, Sport and Tourism >
      • Growth and purpose of leisure time
      • Categories of tourism and sport
      • Economic development and participation
      • Factors affecting personal participation
      • Factors affecting growth of tourism hotspots
      • Spheres of influencee
      • Factors affecting a national sports league
      • Festivals
      • Niche national tourism strategies
      • Role of TNCs
      • Tourism as a national development strategy
      • International sporting events
      • Consequences of unsustainable growth
      • Sustainable tourism
      • Future international tourism
      • Political and cultural influences on sport
    • Extended Essay in Geography >
      • Supervisor meetings
    • Skills/concepts >
      • Infographics
      • 4 Ps
      • Mock examination revision and preparation
  • Geography and ToK
  • Theory of Knowledge
    • Knowledge and Technology
    • Knowledge and Language
    • Knowledge and Politics
    • Knowledge and Religion
    • Knowledge and Indigenous Societies

Climate Graphs

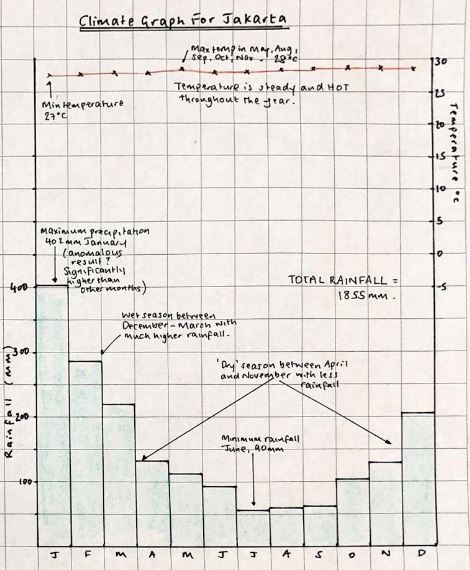
How to draw a climate graph


Use the guidance in the video to draw your own climate graph for Jakarta. Remember:
  • Plan your scale carefully before you start; make sure you leave room for annotations. There are always annotations.
  • Use a ruler and sharp pencil to draw the axes and make sure they are clearly labelled (include units)
  • Plot precipitation as a bar graph. Use a pencil. Add blue.
  • Plot temperature using small neat x's. Position the x in the middle of the month. Use a pencil. Join in red.
Picture
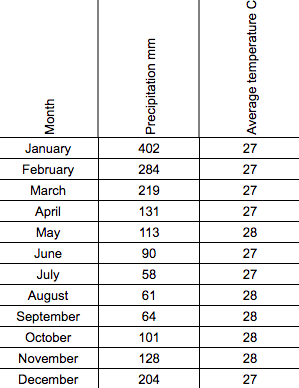
Jakarta Climate Data
climate_data_new_york_and_jakarta.xlsx
File Size: 15 kb
File Type: xlsx
Download File

Example of finished climate graph for Jakarta

How to annotate and analyse a climate graph

Planning is the secret to effective annotation. There is a lot to add so:
  1. Take it slow and think before you write.
  2. Work out where annotations will fit best before adding them.

You should aim to annotate most of the elements listed below. Remember to use DATA to support what you say (ie state the temperature or precipitation values and name the month(s))!
  • Maximum temperature (the month with the highest average temperature)
  • Minimum temperature
  • Temperature range (the difference between the warmest and coldest months)
  • Maximum rainfall
  • Minimum rainfall
  • Seasons - look carefully at your graph and try to identify seasons. There might be a hot season and a cold season; a wet season and a dry season; spring, summer, autumn, winter. Identify when they are and describe them.
  • Anomalies - are there any figures which do not seem to fit the overall pattern?

Comparing climate graphs

Picture
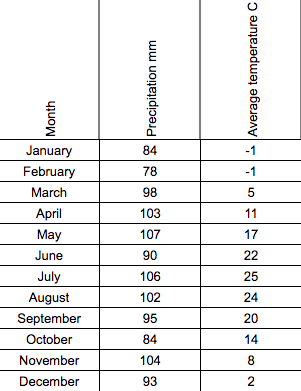
Climate data for New York
  1. Draw another graph to show the climate for New York.
  2. In what ways is it similar to the climate graph for Jakarta? Think about all of the elements listed above (maximum and minimum temperature and rainfall; temperature range; seasonality)
  3. What are the key differences between the climate of New York and Jakarta?
  4. What aspects of weather and climate are missing from climate graphs? Why do you think this is?
Example of finished New York graph
  • Home
    • Contact
  • MYP
    • Development >
      • An unequal world?
      • Billionaires investigation
      • Africa: the danger of a single story
      • Patterns of development
      • Trade and development
      • Fair Trade
      • Sustainable Development Goals
    • Tectonic Hazards >
      • What is risk?
      • Alfred Wegener and Continental Drift
      • Plate tectonics
      • Distribution of tectonic hazards
      • Measuring earthquakes
      • Why do people die in earthquakes?
      • School earthquake plan
      • Earthquake assessment
      • Volcanoes - what are they? Why are they important?
      • Volcano "Science Fair"
      • Causes of tsunami
    • Population >
      • Why study population?
      • Population distribution
      • Population growth
      • Population pyramids
      • Demographic transition model
      • Migration
      • Migration examples - case studies
      • Refugees in Indonesia
      • Population revision activities
    • Weather and Climate >
      • Weather vs Climate and why is it important?
      • Climate graphs
      • Why does it rain?
      • What affects temperature and why is Jakarta so hot and wet?
      • What causes wind and how do we measure it?
      • Microclimates
  • IGCSE
    • Course information
    • Physical: Hazardous environments >
      • Distribution of tectonic hazards
      • Causes of tsunami
      • Measuring earthquakes
      • Earthquake case study 1: Haiti
      • Earthquake case study 2: Christchurch
      • Why do earthquakes do more damage in LICs than in HICs?
      • How are volcanic eruptions measured?
      • Tropical storms - distribution
      • Causes of tropical cyclones
      • Tropical cyclones - case study
      • Why live in hazardous areas?
    • River Environments >
      • Hydrological cycle
      • River basins
      • Factors affecting river regimes
      • Fluvial processes: erosion
      • Fluvial processes: weathering and mass movement
      • Fluvial processes: transportation and depositon
      • River features and their formation
      • How rivers change from source to mouth
      • Uses of water
      • Water pollution
      • Water supply
  • IBDP
    • Changing population >
      • Global patterns of economic development
      • Physical and human factors affecting global population distribution
      • Case study 1: China
      • Case study 2: Niger
      • Demographic transition
      • Megacity growth
      • Forced migration and internal displacement
      • Ageing populations
      • Pro-natalist and anti-natalist policies
      • Gender equality policies
      • Trafficking policies
      • The Demographic Dividend
    • Global climate vulnerability and resilience >
      • Atmospheric system
      • The energy balance
      • Changes in the energy balance
      • The enhanced greenhouse effect
      • Climate Change and the Hydrosphere, Atmosphere and Biosphere
      • Impacts of climate change on people and places
      • Disparities in exposure to climate change risk and vulnerability
      • Government-led adaptation and mitigation strategies
      • Civil society and corporate strategies
    • Global resource consumption and security >
      • Progress towards poverty reduction
      • Measuring trends in global consumption
      • Global patterns and trends in the availability and consumption of water
      • Global patterns and trends in the availability and consumption of land/food
      • Global patterns and trends in the availability and consumption of energy
      • Water food and energy nexus
      • Recycling and waste
      • Malthus vs Boserup
      • Resource Stewardship strategies
      • Sustainable Development Goals
    • Freshwater - drainage basins >
      • The drainage basin as a system
      • How rivers change from source to mouth
      • River discharge
      • River processes
      • River landforms
      • Factors affecting flood risk
      • Attempts at flood prediction
      • Flood mitigation
      • Flood mitigation case studies
      • Water scarcity
      • Agricultural activities and water quality
      • Pressures on lakes and aquifers
      • Internationally shared water and conflict
      • Water management: participation of local communities
      • Dams as multi-purpose schemes
      • Water management: Integrated Drainage Basin Management (IDBM)
      • Managing wetlands
    • Leisure, Sport and Tourism >
      • Growth and purpose of leisure time
      • Categories of tourism and sport
      • Economic development and participation
      • Factors affecting personal participation
      • Factors affecting growth of tourism hotspots
      • Spheres of influencee
      • Factors affecting a national sports league
      • Festivals
      • Niche national tourism strategies
      • Role of TNCs
      • Tourism as a national development strategy
      • International sporting events
      • Consequences of unsustainable growth
      • Sustainable tourism
      • Future international tourism
      • Political and cultural influences on sport
    • Extended Essay in Geography >
      • Supervisor meetings
    • Skills/concepts >
      • Infographics
      • 4 Ps
      • Mock examination revision and preparation
  • Geography and ToK
  • Theory of Knowledge
    • Knowledge and Technology
    • Knowledge and Language
    • Knowledge and Politics
    • Knowledge and Religion
    • Knowledge and Indigenous Societies