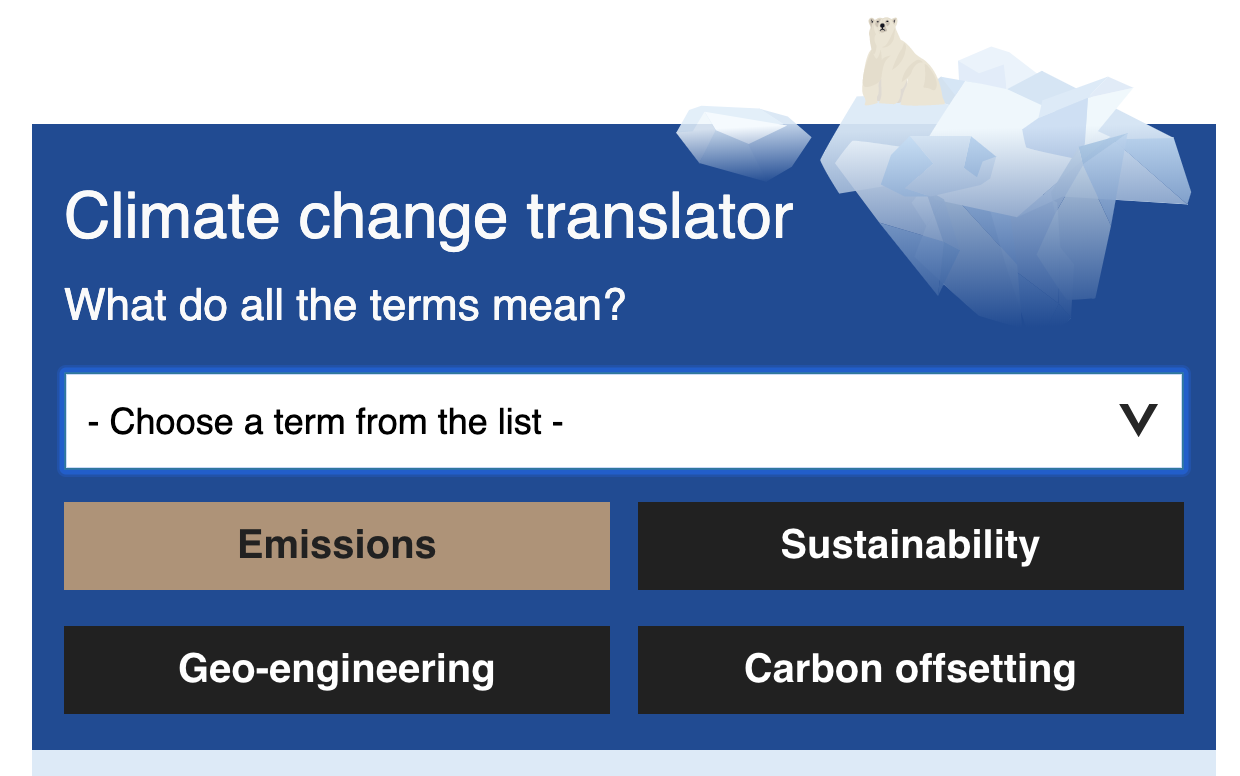
Excellent tool for learning and checking your understanding of key terms
Subject Guide
The enhanced greenhouse effect and international variations in greenhouse gas sources and emissions, in relation to economic development, globalization and trade.
Main task
Complete all of the tasks below. Use your notes and conclusions to create an analysis that describes and explains international variations in greenhouse gas sources and emissions in relation to the three factors above. Use the 4P's approach to structure your response:
1. Place - What are the global patterns of greenhouse emissions? How are these linked to economic development? What are the similarities and differences between cumulative emissions, annual emissions and emissions per capita?
2. Processes - What are the sources of these emissions? How do atmospheric processes mean that emissions are an international concern? How are the emissions connected to processes of globalisation and trade?
3. Possibility - What steps could be taken to reduce emissions? How will this need to be connected to trade and globalisation?
4. Power - Who will be the key decision makers in the future patterns of emissions? Think about national and international politics, the SDGs as well as big business and ground roots environmental activists.
Your analysis can take any form that you judge to be appropriate: a written analysis, slide show, infographic or video could all work. You must include place specific data and graphics.
1. Variations in emissions
a) Total emissions
The map above shows the cumulative emissions of each nation through time from the industrial revolution in 1750 to 2014.
1) Use the map to describe the patterns of cumultive emissions over time. You should include comment on: the UK, Western Europe, North America, China, India, Russia and other regions.
2) Describe current cumulative totals with reference to specific data.
1) Use the map to describe the patterns of cumultive emissions over time. You should include comment on: the UK, Western Europe, North America, China, India, Russia and other regions.
2) Describe current cumulative totals with reference to specific data.
3. What does this map show? How is this different from Map 1 above?
4. Describe the patterns shown with specific reference to data. What are the similarities and differences between this and the first map? Why are they so similar?
4. Describe the patterns shown with specific reference to data. What are the similarities and differences between this and the first map? Why are they so similar?
b) Emissions per capita
Discuss: why might we expect emissions per capita to be different from total emissions? What variations do you expect and why?
1) Describe the pattern shown in the map. Again, make sure that your description includes reference to Western Europe, US, Canada, China, India, Asia, Sub-Saharan Africa, Australia and Saudi Arabia. You must include data.
2) Try to explain the patterns shown: why is China much lower than in total emissions? Why do the countries of Europe seem so relatively low? Why are Australia, USA, Canada, Saudi Arabia so low? Explain the data for Russia.
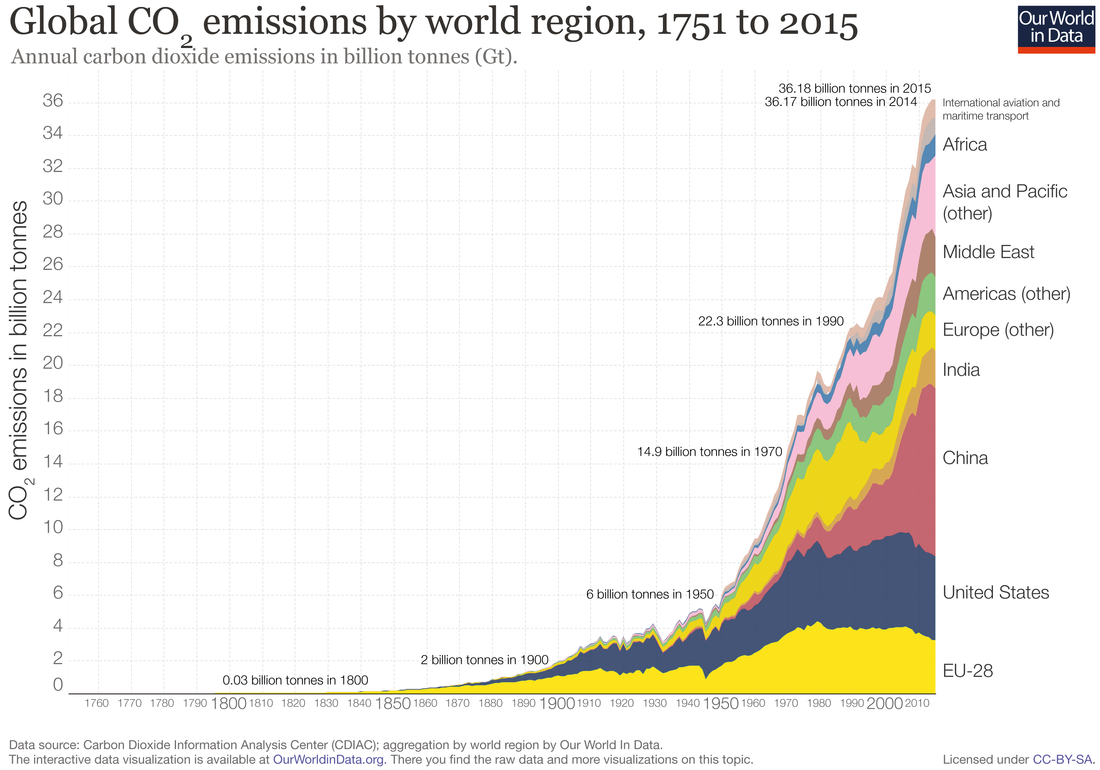
3. Study the graph above. Describe and explain the patterns shown -
- Which country has seen the biggest increase in CO2 since 1970?
- Comment on US Co2 emissions since 1970.
- How many billion tonnes of C)2 is Asia Pacific producing in 2015?
2. Emissions and level of development
1) Investigate the correlation shown in the graphs above. To what extent would you agree that emissions and wealth are connected?
|
|
|
2) Use your own knowledge and the video clips above to explain the correlation shown. Consider: industry, personal use of electricity, transport demands, agriculture including meat consumption.
Now study the graph below and discuss with a partner what the data shows:
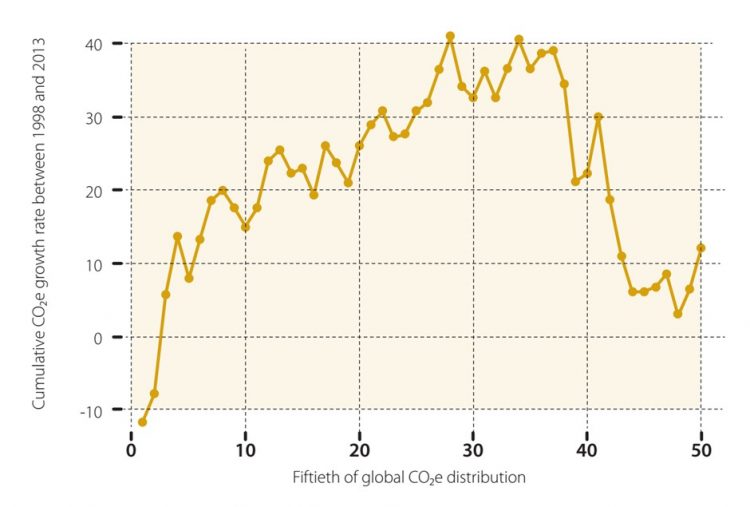
3) Divide the graph into the largest, middle and smallest emitters and comment on the changes shown.
4) Why might the data behind this graph be regarded as "good news" for the global middle classes? Where are the "global middle class" found?Why might they be reluctant to spend money to reduce emissions without support from HICs?
5) Why might this data be regarded as bad news for the poorest global citizens?
3. Emissions and globalisation and trade
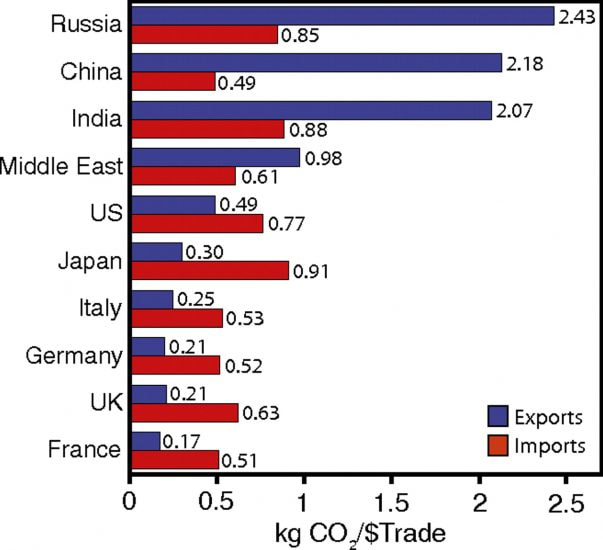
A country’s carbon emissions are generally measured as the emissions that occur within its border. This is sometimes referred to as “territorial-based” emissions. This method takes no account of emissions which may be imported or exported in the form of traded goods. “Consumption-based” accounting adjusts CO2 emissions for this trade of emissions and more accurately reflects the emissions necessary to support a given country’s way of living.
1) Study both of the graphs below and describe in your own words what each shows.
2) How does this data support the idea that we should look beyond greenhouse emissions produced only within countries?
1) Study both of the graphs below and describe in your own words what each shows.
2) How does this data support the idea that we should look beyond greenhouse emissions produced only within countries?
|
|
Study the map below very carefully. It shows CO2 "embedded in trade".
Net emissions transfers = CO2 embedded in imported goods - the CO2 embedded in exported goods.
This tells us whether a country is a net exporter or importer of emissions. Positive values (red) show that a country is a net importer of emissions. Negative values (blue) show net exporters.
Here we see an important East-to-West relation, with large exports from Asia and Eastern Europe into Western Europe and North America. In other words: some of the CO2 produced (and reported) in emission records of Asian and Eastern European countries is for the production of goods consumed in Western Europe and North America.
Based on the updated data gathered by Peters et al. (2012) and the Global Carbon Project, if we switched to a consumption-based reporting system (which corrects for this trade), the annual CO2 emissions of many European economies would increase by more than 30% (the UK by 38%; Sweden by 66%; and Belgium’s emissions would nearly double); and the USA’s emissions would increase by 7%. On the other hand, China’s emissions would decrease by 13%; India’s by 9%; Russia’s by 14% and South Africa by 29%.